
Understanding Bitcoin During the COVID Crisis
![]() 9 min read
9 min read
- Bitcoin
Bitcoin’s movements during 2020 may well have surprised people.
When markets fell across the board in early March, bitcoin tumbled alongside them. Whilst, leading up to March, bitcoin’s market cap of around $170bn was still tiny when compared to equities, treasuries or gold, the sheer magnitude of a 50% drop in two days compared to other assets certainly raised some eyebrows.
However, its subsequent rebound to pre-COVID levels without intervention or external stimulus has also unsurprisingly garnered attention amongst the investment community.
We believe understanding how and why these movements occurred are important questions to answer; not least because knowing the mechanisms that were at play could help investors get a better understanding of which metrics are useful in gauging ongoing volatility risk.
Understanding also helps us appreciate just how resilient Bitcoin can be.
So, what happened and why?
In short, we believe the tumble was ignited by fear spreading from other markets. It then became particularly severe due to bitcoin’s unique market structure. The overall usage of leverage in bitcoin spot and derivatives markets is generally large, but in the time leading into March 12 & 13, leverage levels were abnormally high, making them extra vulnerable to shocks.
When spot markets started coming down alongside global financial markets, this triggered a particularly sharp liquidation cascade. It started on leveraged spot and derivatives exchanges. Then, due to the speed and size of the price drop, a minimum of $500m (likely as much as $1bn or more) of btc-collateralised loans were auto-liquidated, adding further selling pressure to spot exchanges over a very short time.
Interestingly, even after sustaining a drop of that magnitude, Bitcoin not only found a natural bottom, it vigorously rebounded over the succeeding weeks and liquidity levels have normalised. Not only does that demonstrate that what we observed was a market dislocation caused by exogenous shocks, not a broad revaluation, but it also shows that Bitcoin markets are highly resilient and self-correcting, even in the complete absence of external intervention.
In its aftermath, Bitcoin’s market structure has not materially changed and there is little reason to expect that it will over the near- to mid-term. In other words, it is possible that, given the right set of circumstances, volatility events like the one we saw in March could happen again.
Let’s examine this in more detail below...
Financial Markets Were on Shaky Ground in Early March
Coming into the second week of March, global equity markets had already come approximately 20% off of their February highs due to Covid fears. Traditional safe haven assets such as gold and treasuries were outperforming. Certain other assets, such as oil, fared particularly poorly as global air travel came to an almost complete halt.
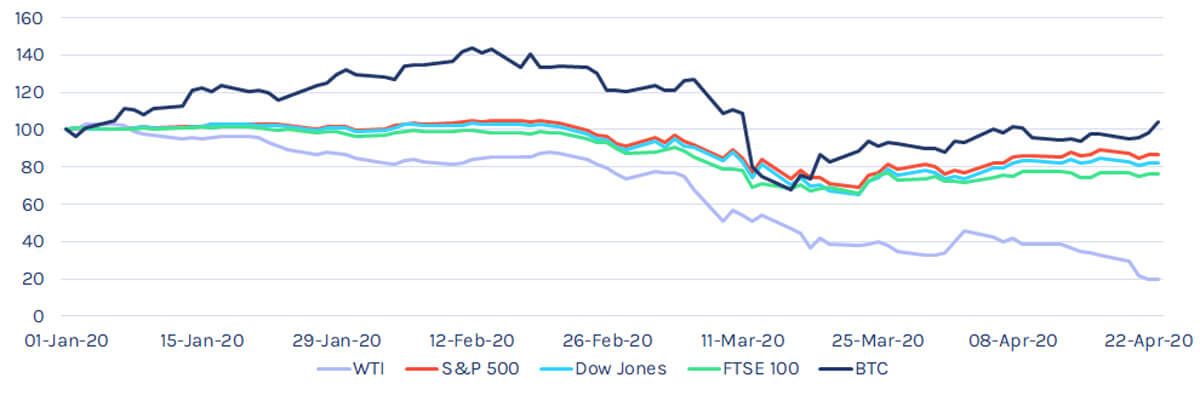 Source: All data from Bloomberg, indexed to 100. Note that benchmark indices are price return, WTI = United States Oil Fund LP (USO ETF), BTC = XBTUSD Currency.
When governments began implementing broad lockdowns across Europe and North America, effectively shuttering large swaths of their respective economies, panic hit pretty much every market which ignited a stampede for cash.
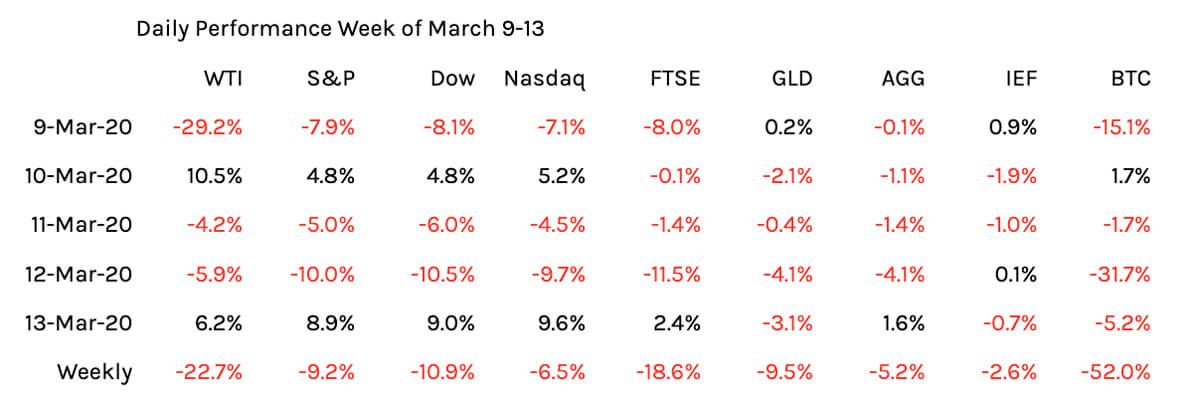 Source: All data from Bloomberg. Note that benchmark indices are price return, WTI = United States Oil Fund LP (USO ETF), GLD = SPDR Gold Trust, AGG = iShares Core U.S. Aggregate Bond ETF, IEF = iShares 7-10 Year Treasury Bond ETF, BTC = XBTUSD Currency.
Inflows into cash instruments reached record levels as investors rushed for the safety of the dollar. According to Bank of America, in the five days leading into March 11, investors piled $137bn into cash-like assets, the fourth largest move of its type ever (1).
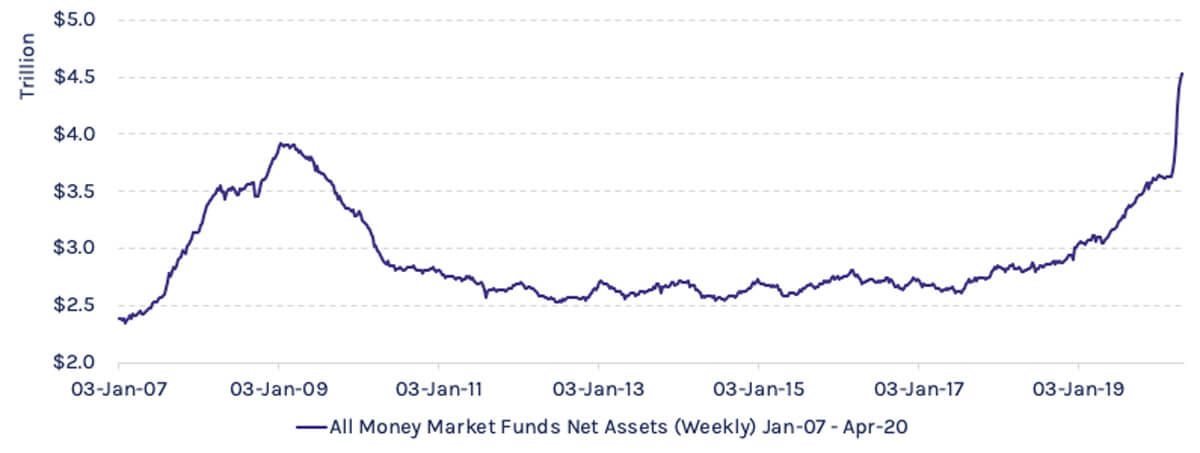 Source: Bloomberg
Even the safest of havens faltered. On March 12, the worst performing day for bitcoin, both gold and US Treasuries fell by 4.1% in a single session. At the end of the week of March 9-13, gold (GLD) was down 9.5% and US Treasuries (IEF) 5.2%.
 Source: Bloomberg
Leverage Levels in Bitcoin Markets Makes Them Vulnerable to Shocks
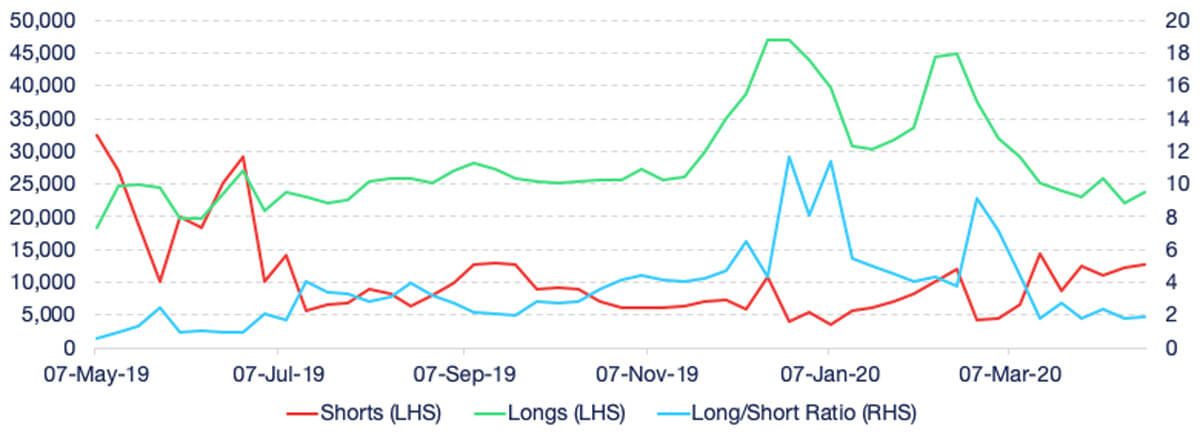
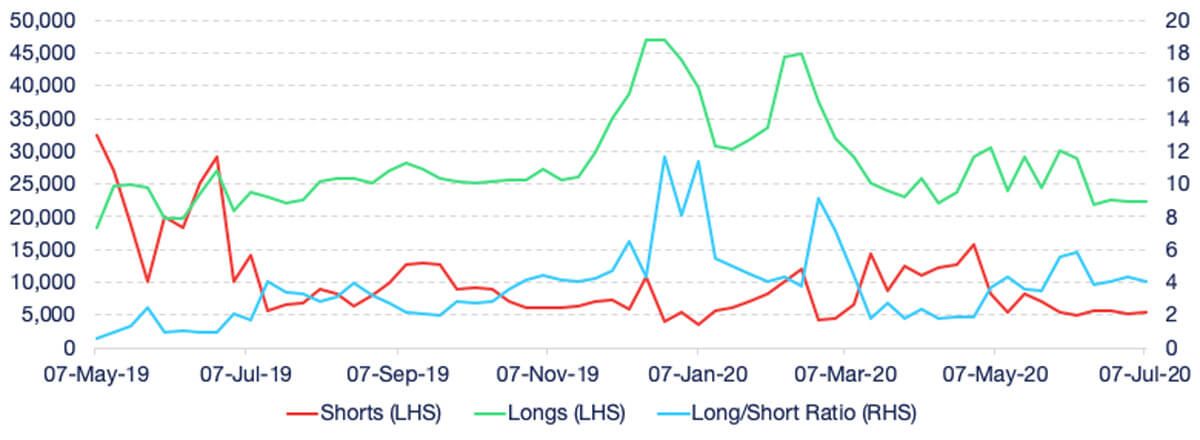
Meanwhile, in bitcoin markets, leverage had been building in various forms. USD lending rates on margin platforms were elevated, and Long/Short (L/S) ratios at spot exchanges such as Bitfinex were hovering at abnormally high levels. Having come down from twin peaks of almost 12x in late December and early January, L/S ratios spiked back above 9x in the weeks leading up to March 11. By March 17, the ratio had dropped to less than 2x.
 Source: datamish.com
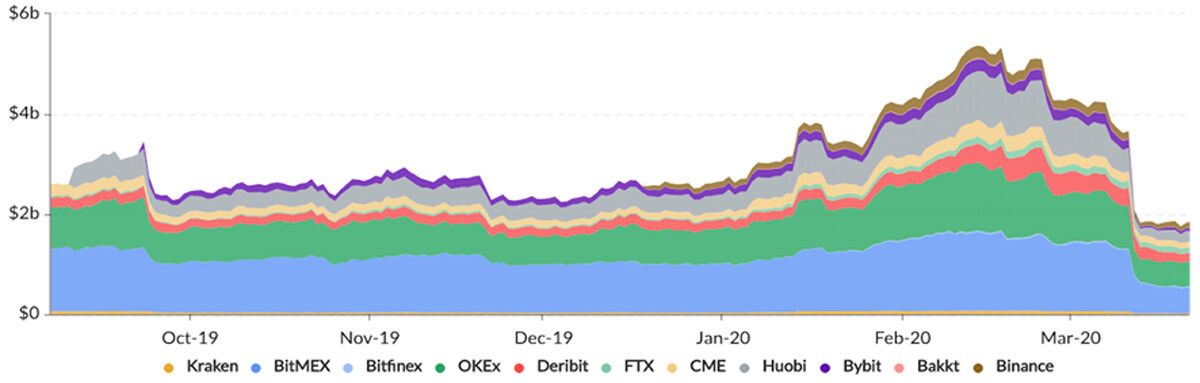
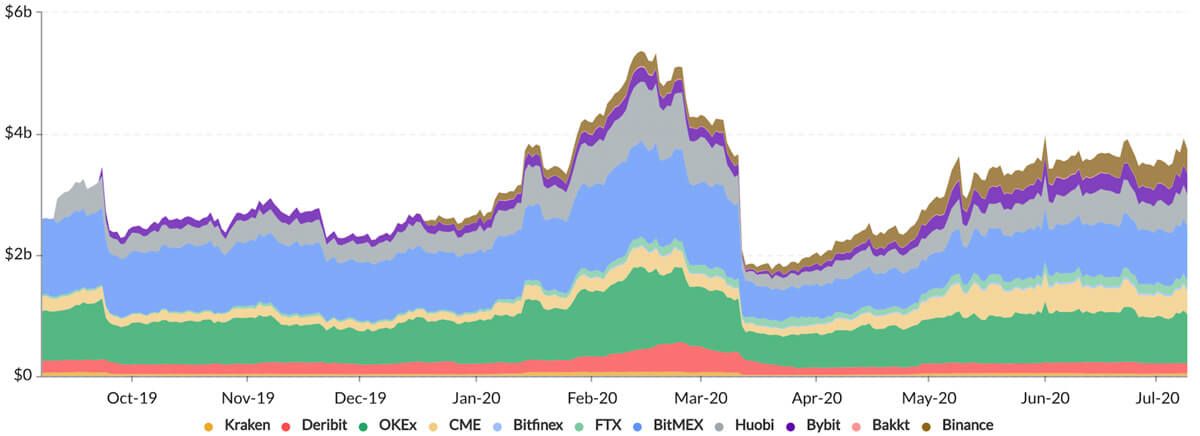
The situation on derivatives exchanges did not help. Around mid-February, open interest reached more than $5bn, an all-time high. While about $1.7bn of these positions had been unwound before March 11, the real drop came between March 12 & 13. As spot prices were coming down, futures came down even harder, at certain points falling below spot. This caused a liquidation cascade, which wiped out $1.8bn worth of derivatives open interest in less than 48 hours. On BitMex alone, there were $863m and $798m worth of sell liquidations on March and 12 and 13, respectively, representing approximately 9% of total daily trading volume on both days.
 Source: skew.com
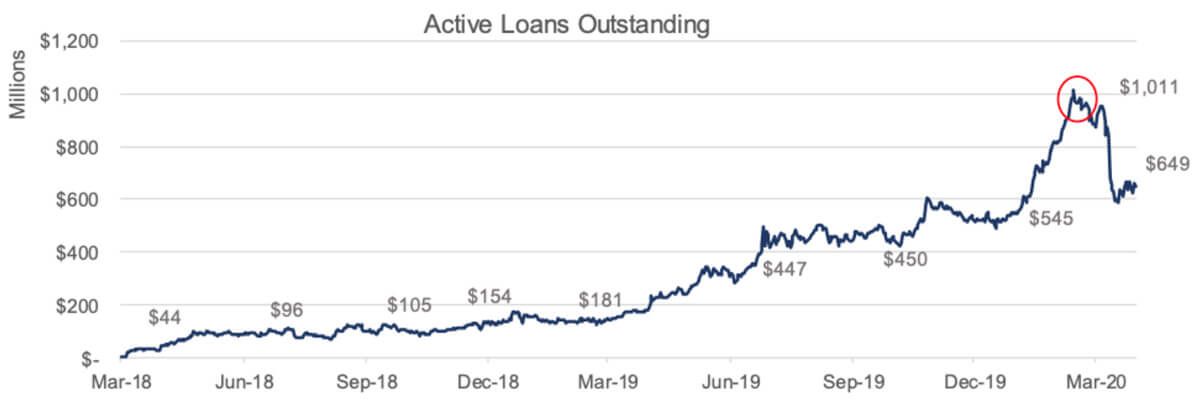
Leading directly into March 12, the amount of outstanding btc-collateralised loans on lending boks were also likely at all-time highs. The loan book of Genesis trading alone peaked at more than $1bn in late February. The combination of size and speed in the spot market drops caught many borrowers who had posted bitcoin as collateral for their positions off-guard. Even though most such loans are over-collateralised by as much as 40%, a price drop of 50% outpaced some borrowers ability to top up their bitcoin collateral with on-chain transactions (accessing bitcoin from cold-storage is sometimes a deliberately cumbersome process), causing at least $500m of loans to get auto-liquidated by lenders. This added another $500m of selling pressure on spot exchanges over a very short time-span.
 Source: Genesis Capital
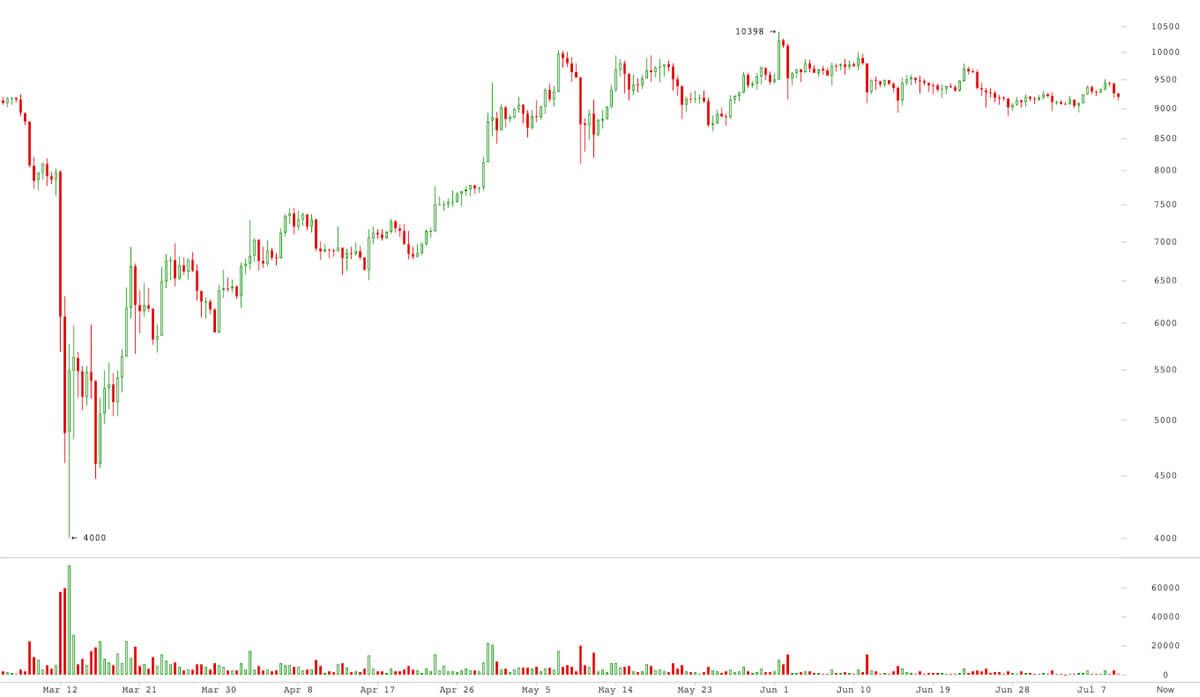
However, markets eventually found a bottom between ~$3,500 and ~$4,000, depending on the exchange. The recovery was relatively swift and by March 20, prices were already flirting with $7,000-levels again. Overall, the v-shaped recovery shows that this was a short-term market dislocation, not a more broad-based revaluation.
 Source: bitcoinwisdom.io (10 July 2020)
Monitoring Leverage Metrics Should Help in Gauging Ongoing Volatility Risk
Bitcoin’s recovery has been stronger and faster than almost all other markets. At the time of writing, bitcoin is trading around $9,200, up 130% from its bottom and up 28% since the start of the year. While the drop was historically large, the price eventually found support and stabilised itself without any need for external intervention.
Meanwhile, leverage levels have started to rebuild on both spot and derivatives exchanges. Open interest on derivatives exchanges has grown back above pre-March 12 levels and are re-approaching all-time highs. Of particular interest here is the observation that open interest on the CME is near record levels, having more than tripled since the start of the year.
 Source: skew.com (10 July 2020)
After bottoming right above 2x, Bitfinex L/S ratios have climbed back to 4.0x. While the ratio is markedly lower than at its twin-peak-level of almost 12x in late December and early January, 4.0x is still relatively high on a yearly basis.
 Source: datamish.com
The btc-collateralised loan market seems to have cooled down somewhat compared to pre-March levels, but it is recovering. Comprehensive data to quantify total current open interest between all lending desks has not been possible to gather, but lenders claim the market, while still some ways off of its peak levels, is growing steadily and stands poised to grow past previous records if market conditions remain relatively stable.
The continued and common usage of leverage in bitcoin markets means that the bitcoin price remains vulnerable to volatility spikes. If outside events of similar magnitude were to recur, it is not unlikely that bitcoin prices would behave in a similar way. Keeping an eye on these metrics should help in gauging ongoing volatility risk.