



The state of Hybrid Finance 2026
 25 min read
- Finance
- Data
Our first report with Token Terminal, published in April, measured the size of the tokenised real-world asset market: more than $40B of on-chain market capitalisation across tokenised funds, stocks and commodities. Establishing that assets exist on-chain is one thing. This second edition asks whether anyone is actually using them.
Over the twelve months to Q2 2026, the answer separated sharply from the crypto cycle. Total deposits across decentralised finance fell by roughly 15%, yet deposits of tokenised real-world assets more than tripled, from $2.3B to $7.4B. Spot trading volumes on decentralised exchanges dropped by around 70%, while spot trading in tokenised assets rose by around 220%. On perpetual futures venues, both volumes and committed capital kept climbing against the same downturn. When an asset class grows through a decline in its host market, the demand behind it is coming from financial utility rather than from the cycle.
Inside the report, you will find a use case by use case account of that year: how tokenised assets are being used as collateral and on which chains, where secondary trading is concentrated, how derivatives markets on real-world assets have developed, what all of this is worth to the venues facilitating it, and how yields ranging from roughly 3.2% to 5.5% are drawing different kinds of investor into different products. It closes with what the next 18 months could look like, and with a comparison worth sitting with: only around $2.2B of a global equity market of more than $100T has been tokenised so far, a position that looks a great deal like stablecoins in 2019.
All underlying data is provided by Token Terminal.
Download the full report as a PDF using the following link, or read it in full below.

One year of data, from Q2 2025 to Q2 2026: tokenised assets are now being used
A word from CoinShares Co-founder, President and CEO
Earlier this year, CoinShares introduced Hybrid Finance as our investment thesis: the conviction that finance is not being disrupted but rewired, at the intersection of performant blockchains, decentralised lending and trading venues, and tokenised representations of traditional asset classes. A thesis is only as good as the evidence that follows it. This report, our second with Token Terminal, is that evidence.
Our first report, published in April, established that the on-chain market capitalisation of tokenised real-world assets had surpassed $40 billion. This edition asks the harder and more important question: are these assets actually being used? The answer is unambiguous. RWA deposits across lending platforms and decentralised exchanges reached $7.4 billion, growing year on year even as total DeFi deposits declined meaningfully. The same pattern holds in trading: while crypto-native spot activity on decentralised exchanges fell by approximately 70%, spot trading in tokenised real-world assets rose roughly 220% over the same period. And on perpetual futures venues, both volumes and open interest in real-world assets continued climbing against a broader crypto-native slowdown.
This divergence is the signal. When an asset class grows through a downturn in its host ecosystem, demand is being driven by financial utility, not by market cycles. That is precisely what Hybrid Finance predicted: tokenisation is structural, not cyclical.
We are still early. Only around $2.2 billion of a global equity market of over a hundred trillions of dollars has been tokenised, a position reminiscent of stablecoins in 2019. But the direction of travel is now measurable, auditable, and on-chain. I invite you to examine the data for yourself in the pages that follow.
Jean-Marie Mognetti
Introduction
The CoinShares x Token Terminal Q1 2026 report, published in April, showed that the on-chain market capitalisation of tokenised real-world assets, or RWAs, had surpassed $40 billion across tokenised funds, stocks, and commodities.
This second report examines how RWAs are used on-chain, focusing on lending, spot trading, and perpetual futures markets, as well as how the venues supporting this activity monetise it.
The report also compares the risk and return profiles of different RWA products and assesses how these characteristics shape adoption across investor groups.
Finally, it considers how the market could develop over the next 18 months.
Reader’s note:
This report is organised by use case. It begins with lending, spot trading, and perpetual futures trading before examining the revenues and valuation multiples of the leading venues. It then turns to yield and investor participation.
This structure reflects CoinShares’ definition of Hybrid Finance as the intersection of performant blockchains, DeFi lending and trading venues, and tokenised representations of traditional asset classes.
This report focuses on distributed assets, i.e. tokenised assets that can be moved to wallets outside the issuing platform. Accordingly, networks such as Canton Network and Provenance are outside the scope of this analysis, as they primarily host represented assets, i.e. tokenised assets that are not broadly transferable across the decentralised lending and trading venues examined throughout this report.
The data in each section is provided by Token Terminal and primarily covers the period from Q2 ’25 to Q2 ’26. Where relevant data is available, longer time periods are included to provide additional context. Unless stated otherwise, year on year comparisons in the charts refer to Q2 ’25 and Q2 ’26.
In this report, tokenised real-world assets, or RWAs, refer to tokenised funds, stocks, and commodities.
The underlying data is available here: https://tokenterminal.com/explorer/studio/dashboards/0b5ddc64-d598-42e0-a44d-78b53a6fb71e
1. Collateral and liquidity
1.1 Use of RWA collateral grows YoY despite DeFi downturn
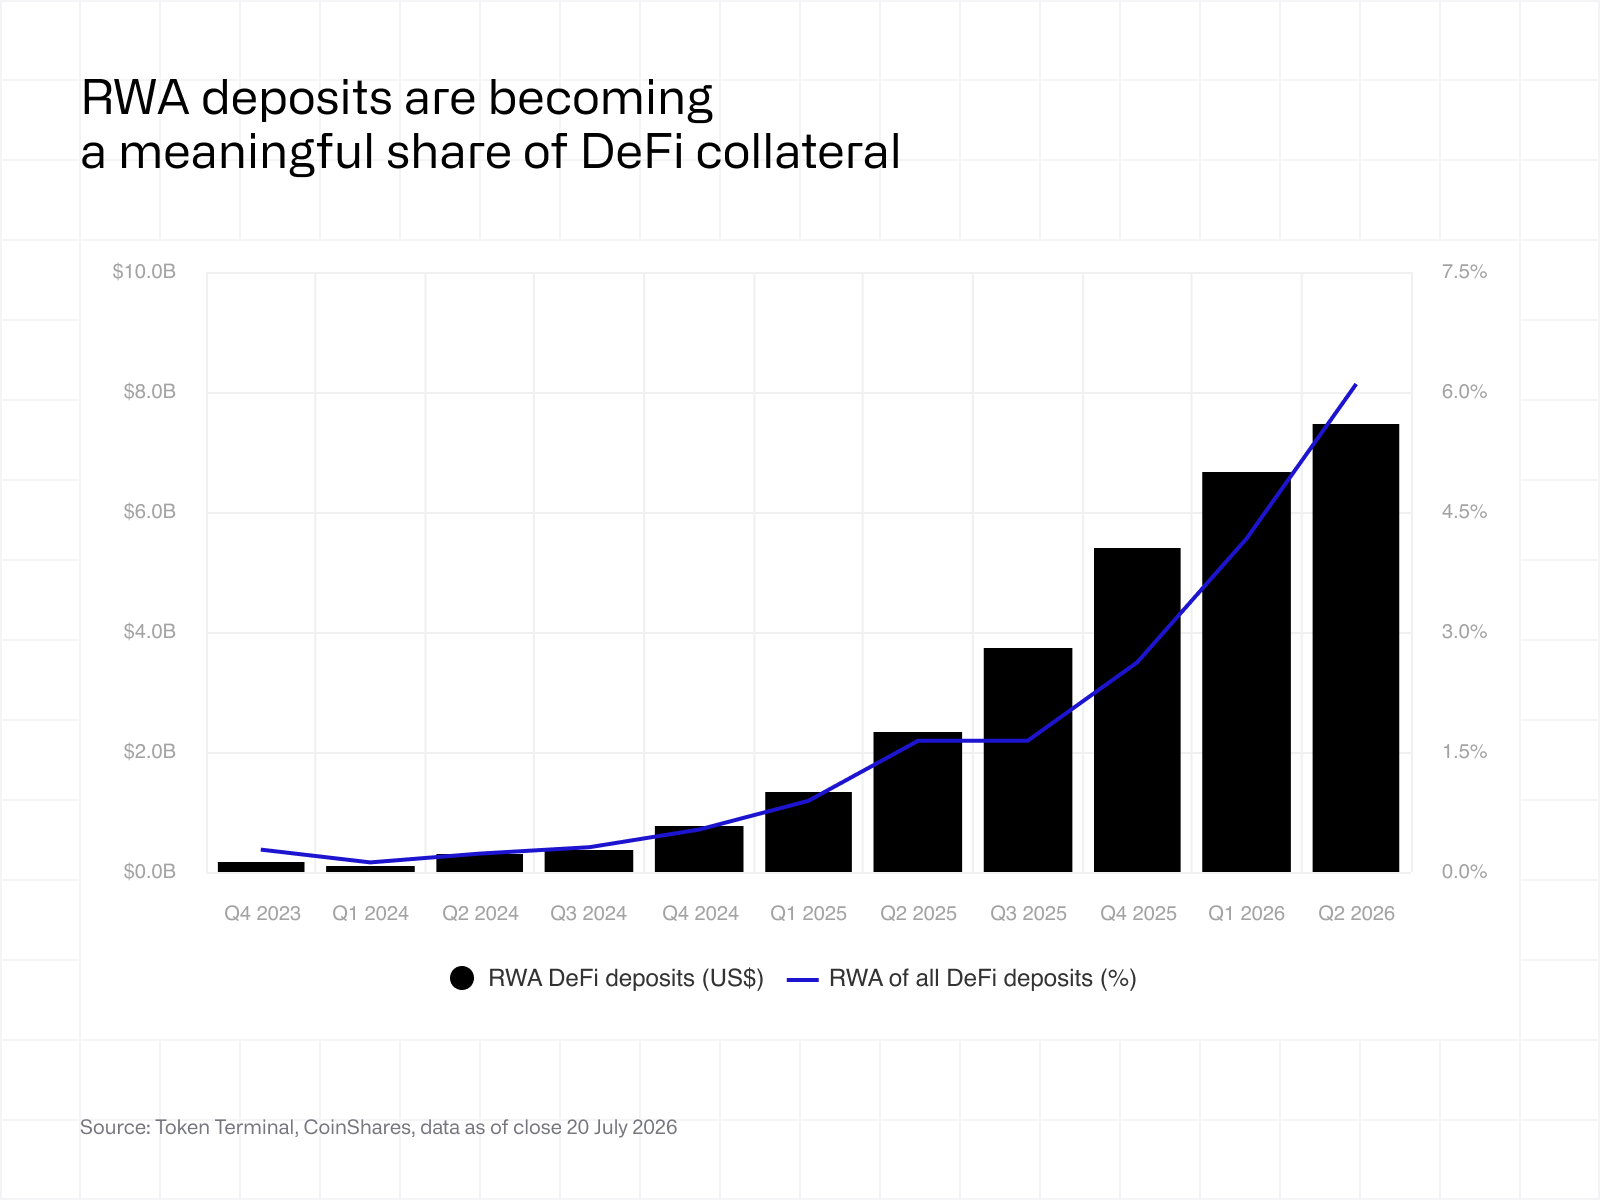 Issuing a tokenised asset is only the first step. The asset’s economic utility increases once it can be used as collateral to access borrowing and other on-chain financial services. RWA deposits therefore provide an indication of how productively tokenised assets are being used beyond issuance.
Between Q2 '25 and Q2 '26, total DeFi deposits fell by approximately 15%, reflecting both investor withdrawals and lower crypto asset prices. Over the same period, RWA deposits across lending platforms and decentralised exchanges more than tripled, from $2.3B to $7.4B.The divergence from broader DeFi trends suggests that demand for tokenised assets is increasingly supported by their financial utility rather than by crypto market conditions alone.
As the first Hybrid Finance report showed, the on-chain market capitalisation of tokenised assets has grown beyond $40 billion. The $7.4 billion now deployed across DeFi represents the next stage of market development, where tokenised assets are increasingly being used rather than simply issued.
1.2 Tokenised funds have emerged as the primary collateral asset
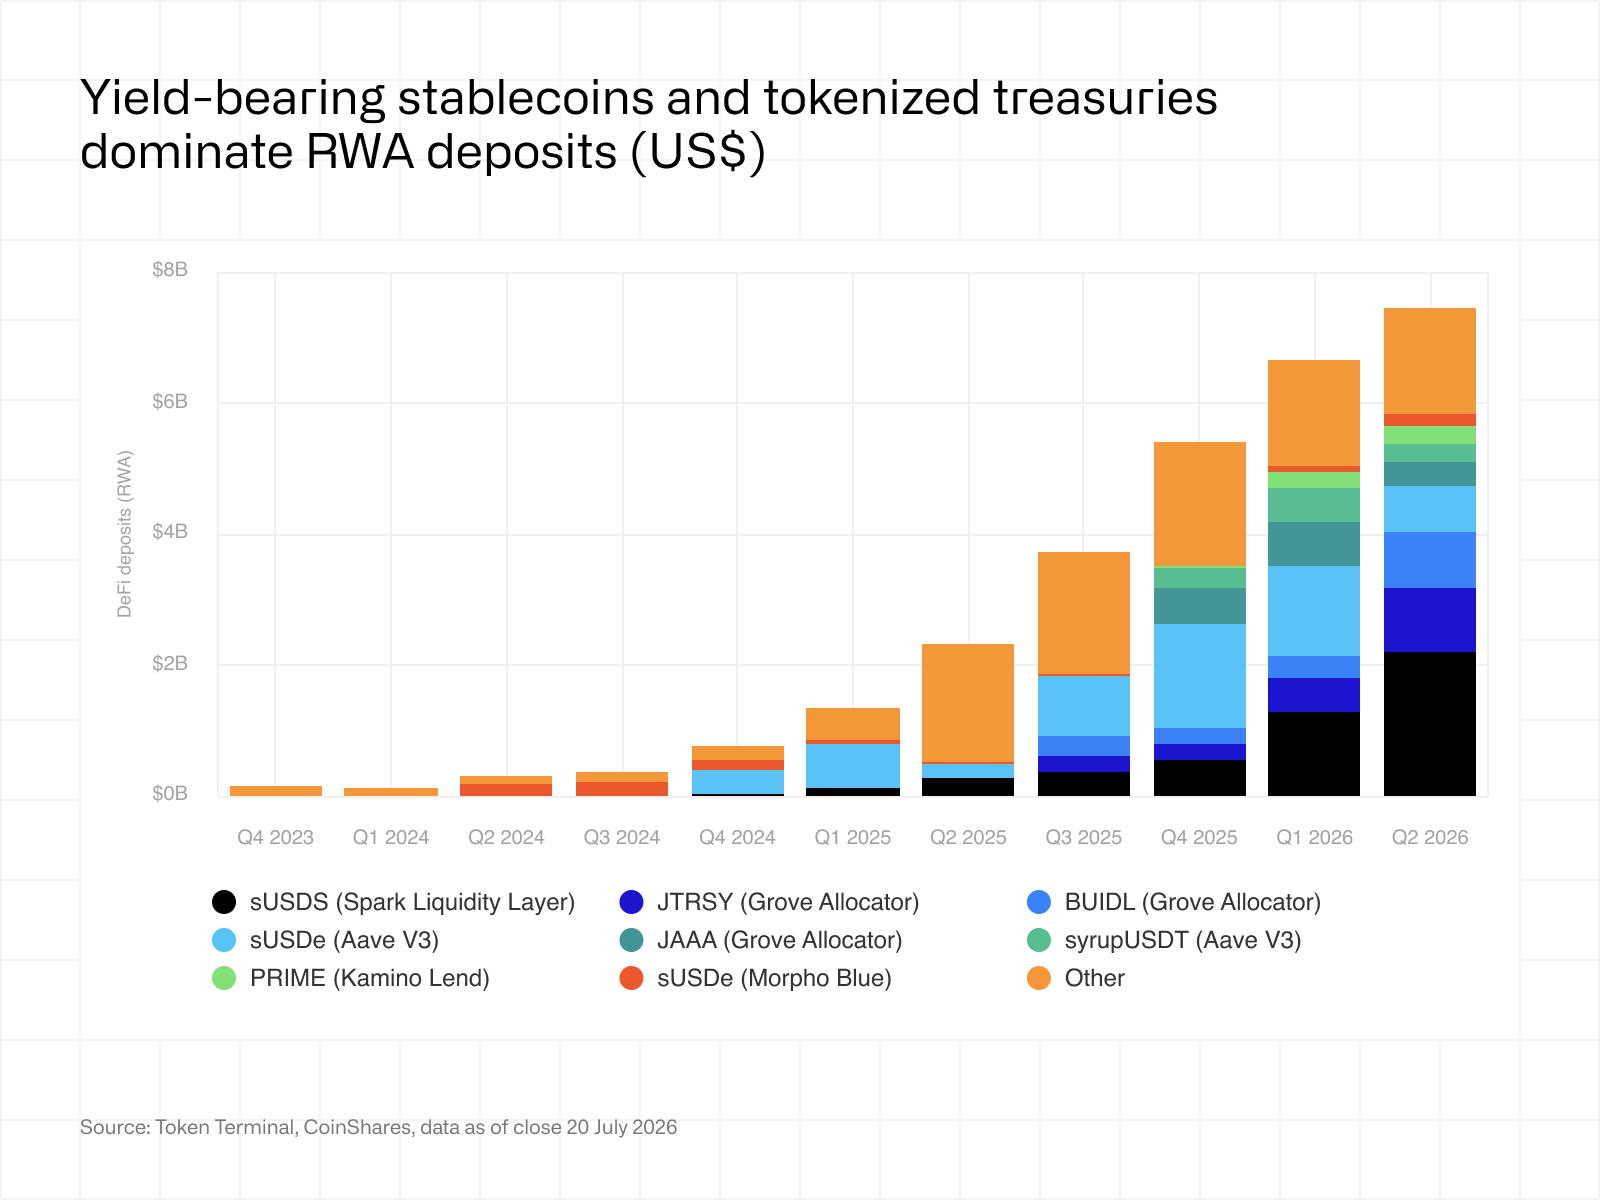 Having established that RWA deposits into DeFi reached $7.4 billion, the next question is which assets account for that growth.
The largest contributors are tokenised Treasury and multi-strategy funds, including JTRSY, BUIDL, and sUSDS, followed by private credit products such as JAAA, syrupUSDT, syrupUSDC, and PRIME, and finally delta-neutral strategies such as sUSDe. Together, these assets account for most of the increase, with a growing long tail of smaller funds contributing the remainder.
This composition reflects a straightforward economic incentive. Investors prefer collateral that continues generating income while supporting borrowing activity, reducing the opportunity cost of locking up capital. Deposits therefore remain concentrated in yield-bearing assets and on established lending venues such as Aave, Morpho, and Kamino, where the deepest liquidity already exists.
1.3 Ethereum’s DeFi ecosystem makes it a natural first choice for borrowers
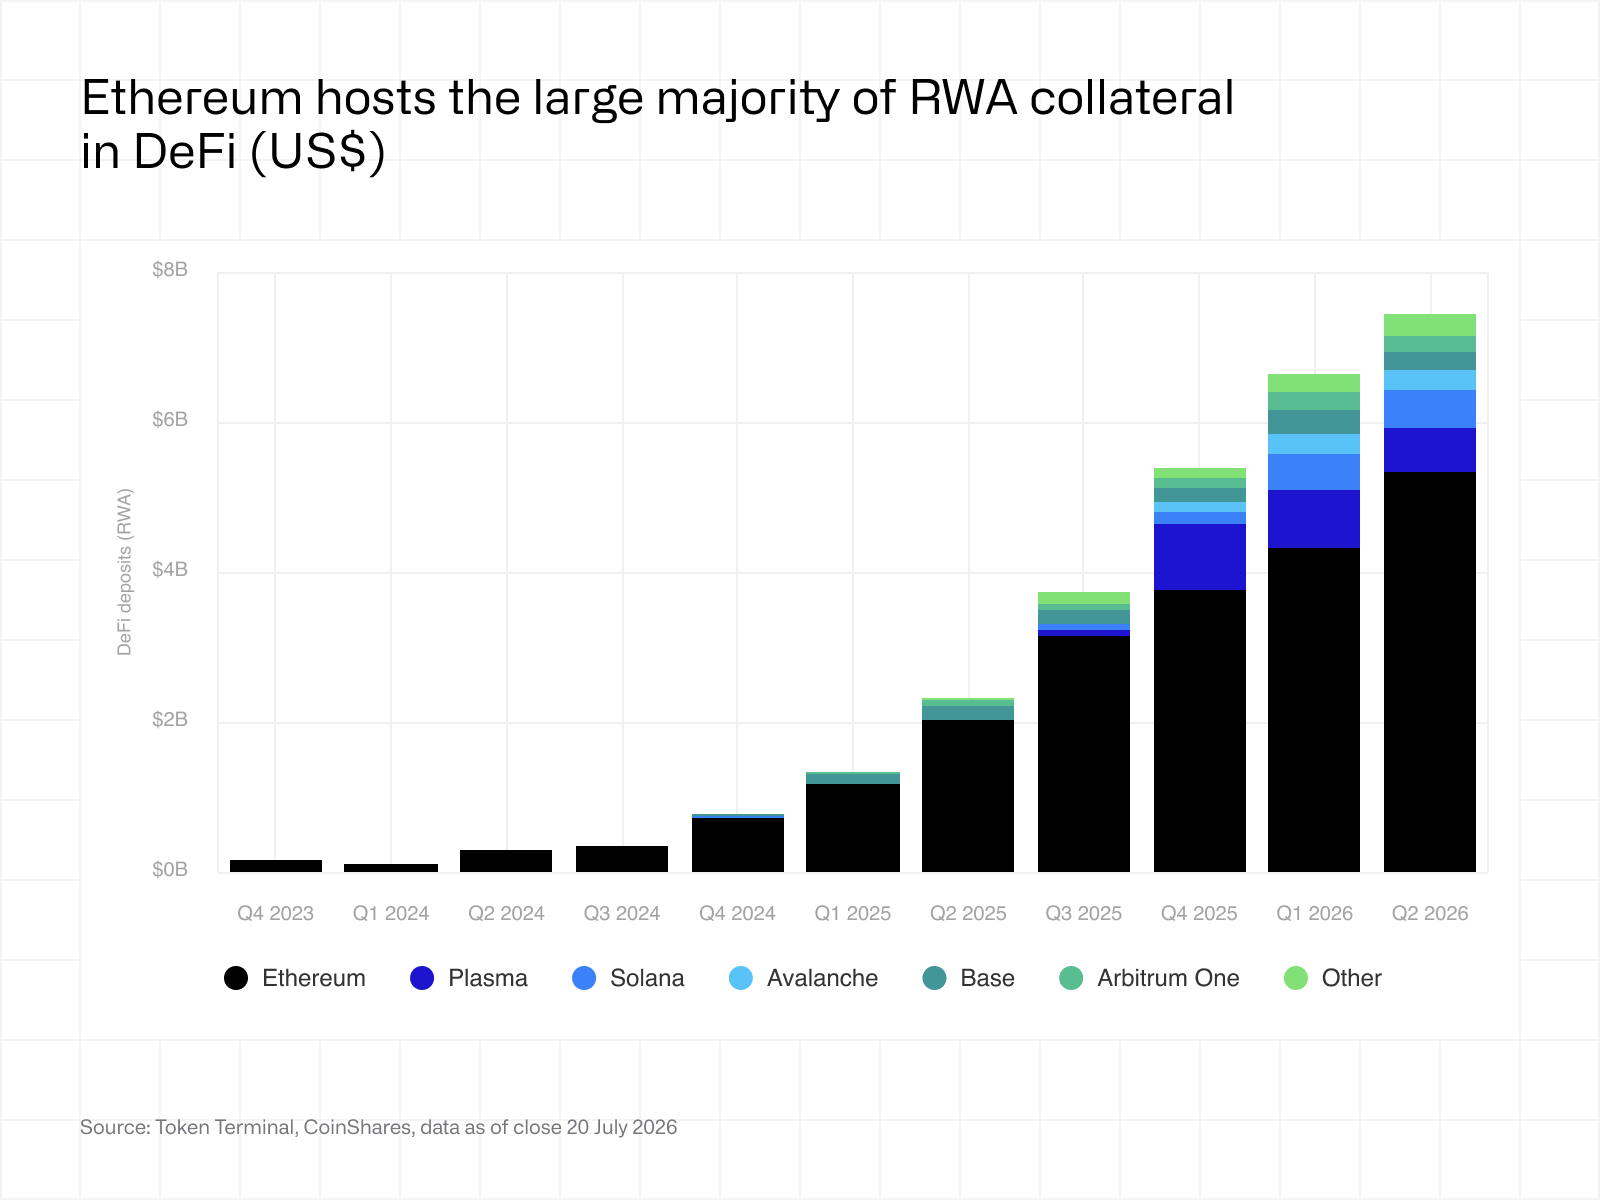 The chain-level breakdown shows that almost 70% of all RWA deposits are allocated to lending venues built on Ethereum, making it the primary ecosystem for on-chain collateral.
Plasma has emerged as the second-largest ecosystem, supported by Aave's expansion beyond Ethereum, while Solana's growth has largely been driven by Kamino, a native lending platform focused on productive uses for RWA collateral.
The distribution reflects one of DeFi's strongest network effects. Borrowers prefer venues with abundant lending liquidity, while lenders allocate capital where borrowing demand already exists. As a result, new ecosystems must build liquidity and trust simultaneously, whereas established ecosystems benefit from both.
2. Decentralised exchange (spot)
2.1 RWA trading volume on spot DEXs grows YoY despite DeFi downturn
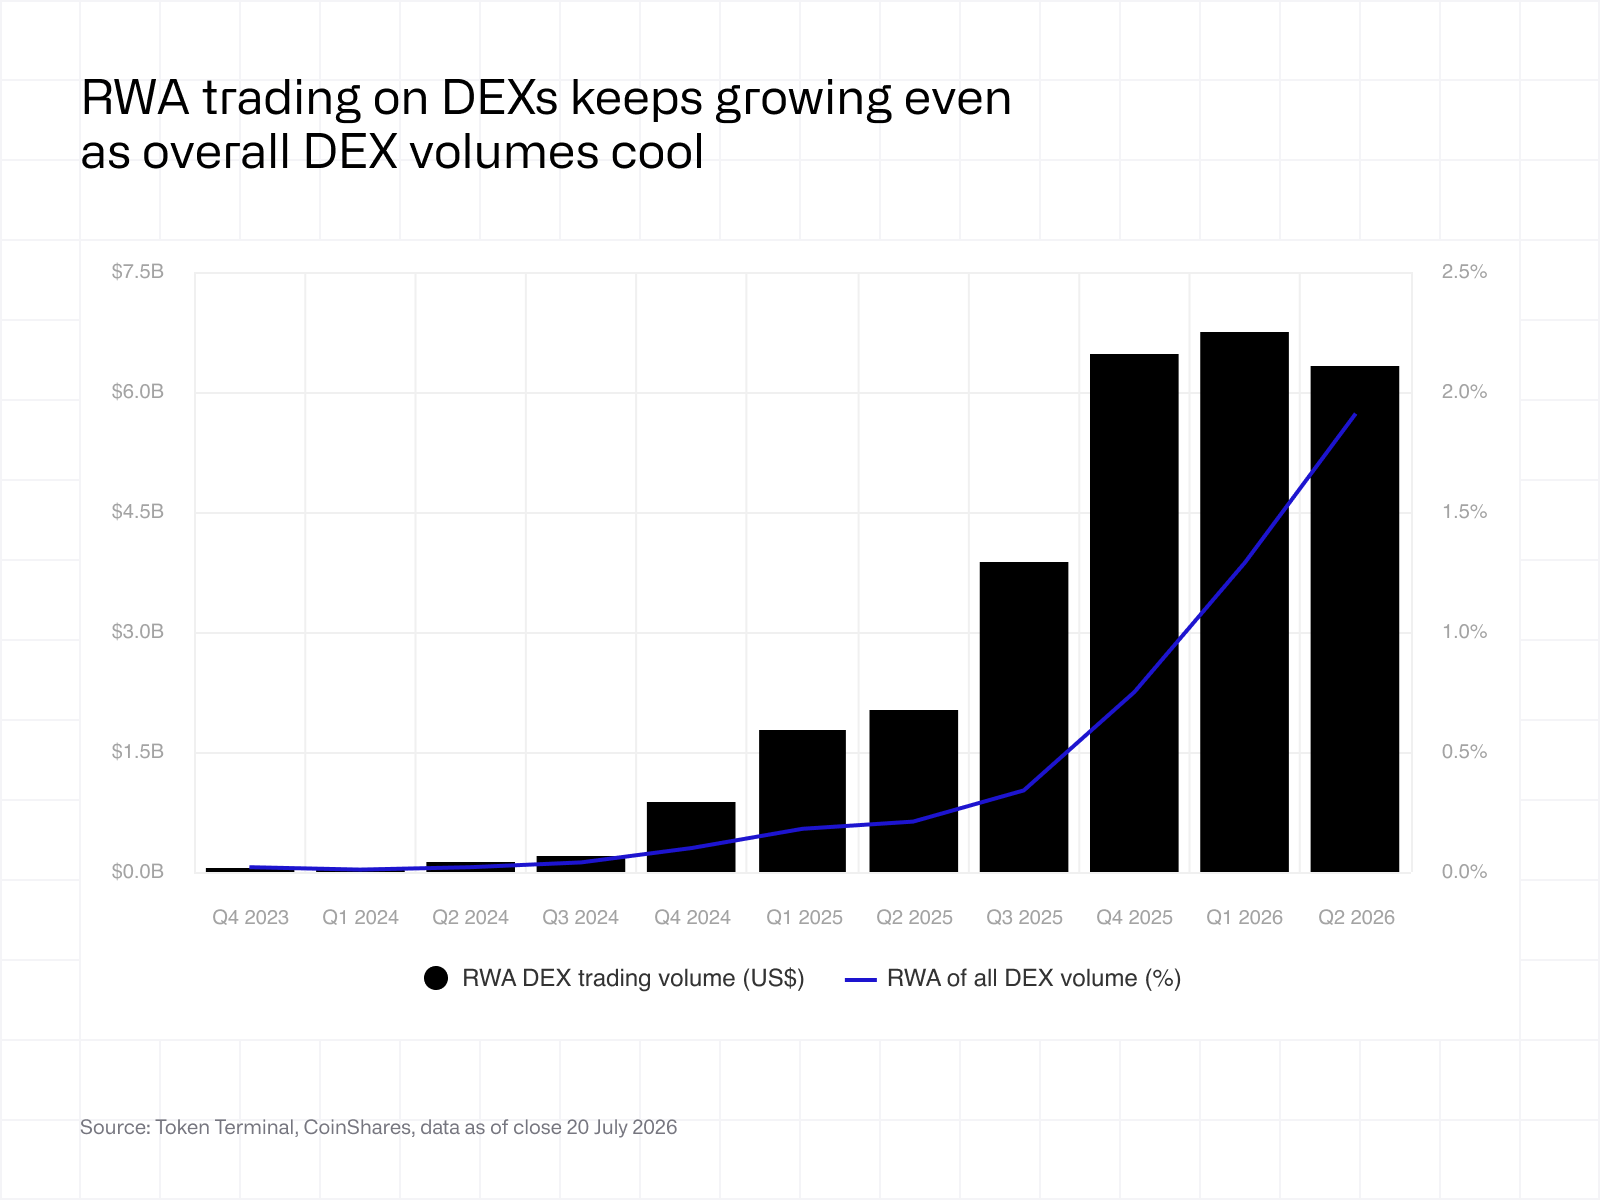 Spot trading is the second major use case that follows issuance. While lending allows investors to borrow against tokenised assets, spot markets allow ownership to change hands, creating secondary market liquidity and enabling investors to trade with one another rather than directly with issuers.
Between Q2 '25 and Q2 '26, aggregate spot DEX volumes, which remain overwhelmingly crypto-native, declined by approximately 70%, while RWA spot trading volumes increased by roughly 220% year on year, albeit from a much smaller base. Although growth has moderated in recent quarters, the divergence from broader DeFi activity suggests that adoption of tokenised assets continues independently of crypto market conditions.
As secondary markets deepen, tokenised assets become more accessible to a broader investor base. Consumer-facing distribution platforms, like Robinhood and Revolut, could further accelerate this trend by directing existing retail users towards on-chain trading venues.
2.2 Volume is concentrated in tokenised gold and funds
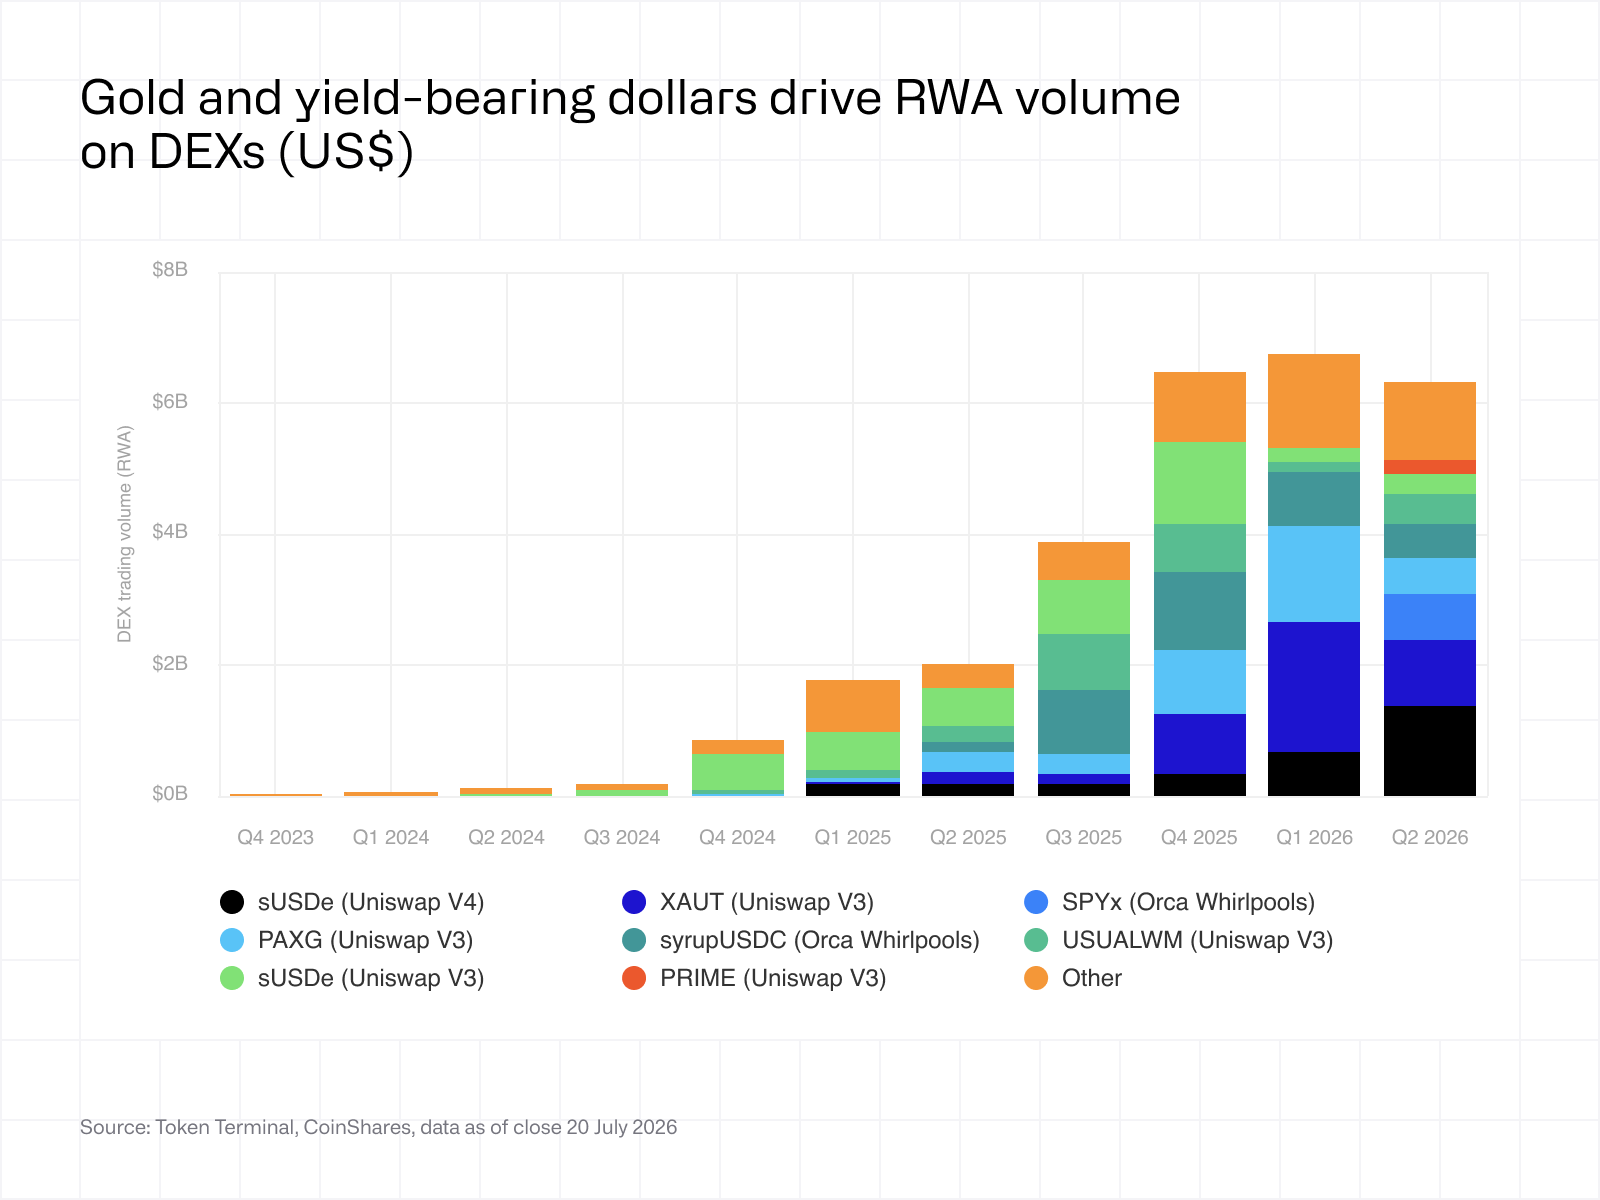 To date, RWA spot trading volumes have been concentrated in a relatively small number of assets, led by tokenised gold and funds, while tokenised equities are beginning to account for a growing share of activity.
XAUT and PAXG generated a significant share of trading volume as investors actively repositioned during periods of appreciation and correction in the gold price. Ethena's sUSDe also contributed meaningfully following the migration of liquidity from Uniswap v3 to Uniswap v4.
Unlike lending and perpetual futures, spot markets do not provide leverage or increase capital efficiency. Their primary role is to facilitate ownership transfer, resulting in structurally lower trading activity than other on-chain financial markets that do provide users access to leverage.
2.3 Ethereum and Solana account for most of the volume
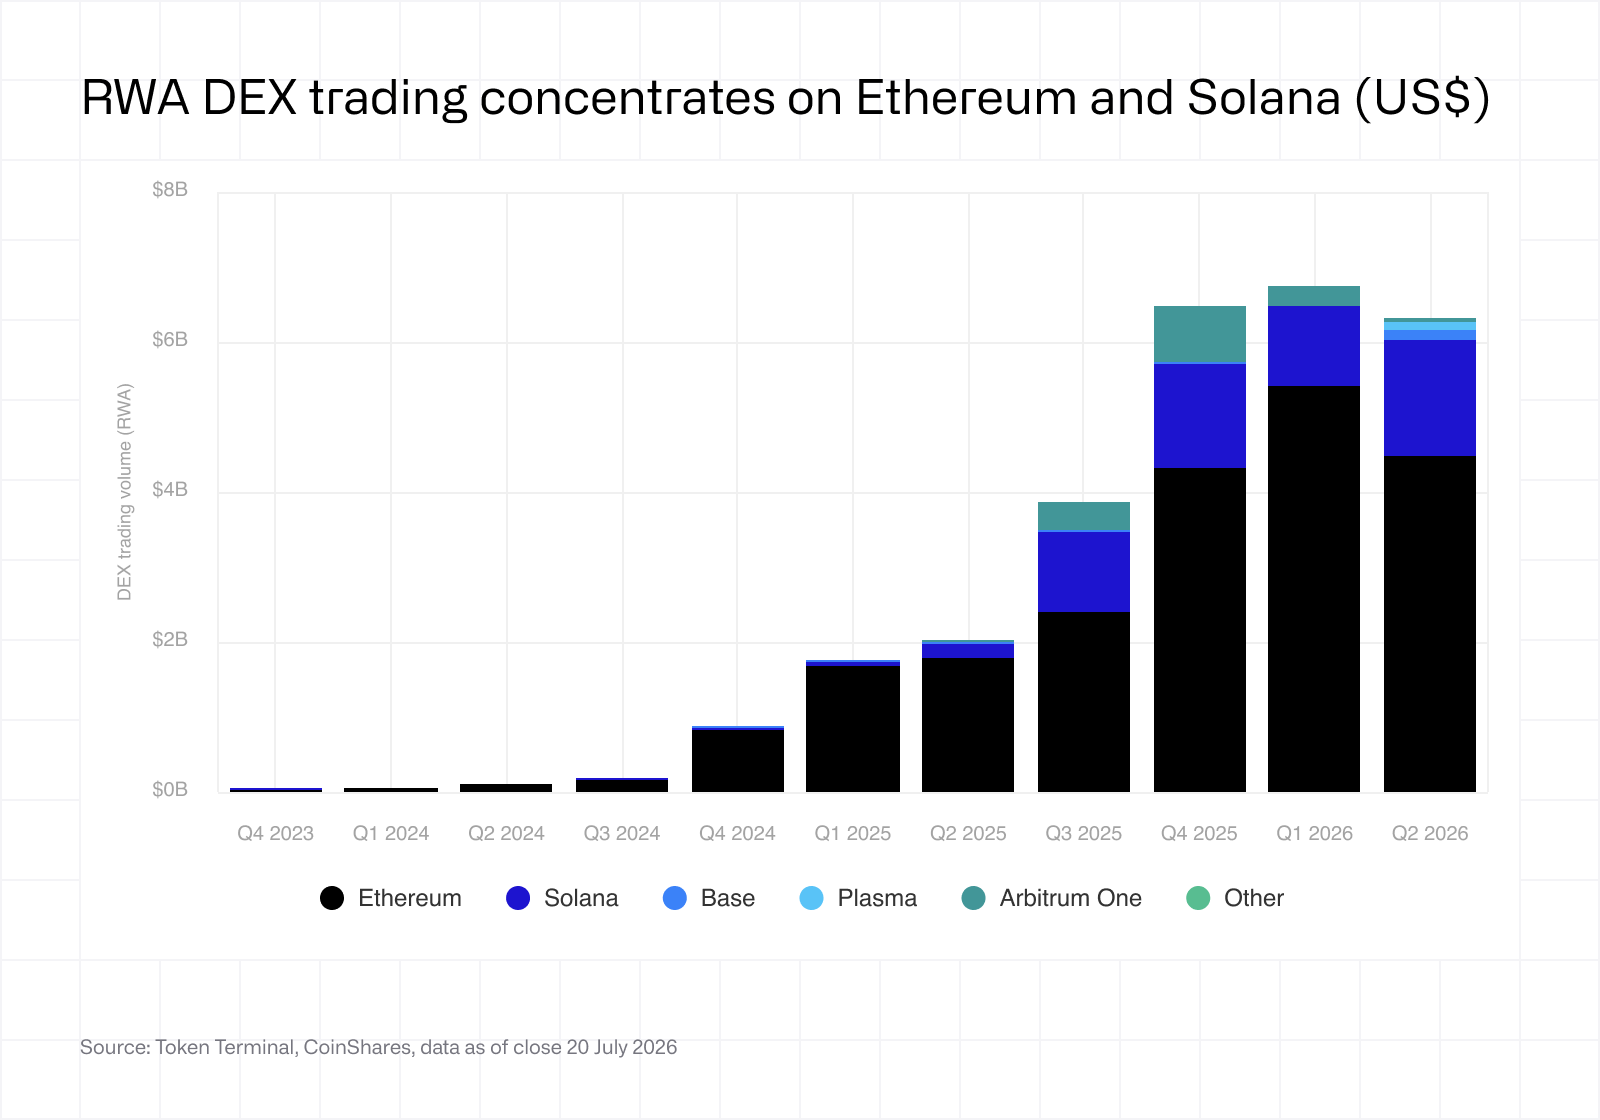 Similar to lending, RWA spot trading remains concentrated on Ethereum, with Solana emerging as the second-largest ecosystem. Despite operating for several years, Arbitrum, BNB Chain, and Base have yet to establish meaningful RWA spot trading activity.
Asset issuers and market makers both benefit from operating where trading infrastructure and liquidity already exist. As a result, new ecosystems face the challenge of attracting both assets and trading activity simultaneously, while established ecosystems continue reinforcing their existing liquidity advantage.
This dynamic also explains why emerging chains compete to attract established DeFi applications. Proven applications bring liquidity, users, and market credibility, reducing the friction involved in building new on-chain financial ecosystems.
3. Decentralised exchange (perpetual futures)
3.1 RWA trading volume on perp DEXs grows YoY despite DeFi downturn
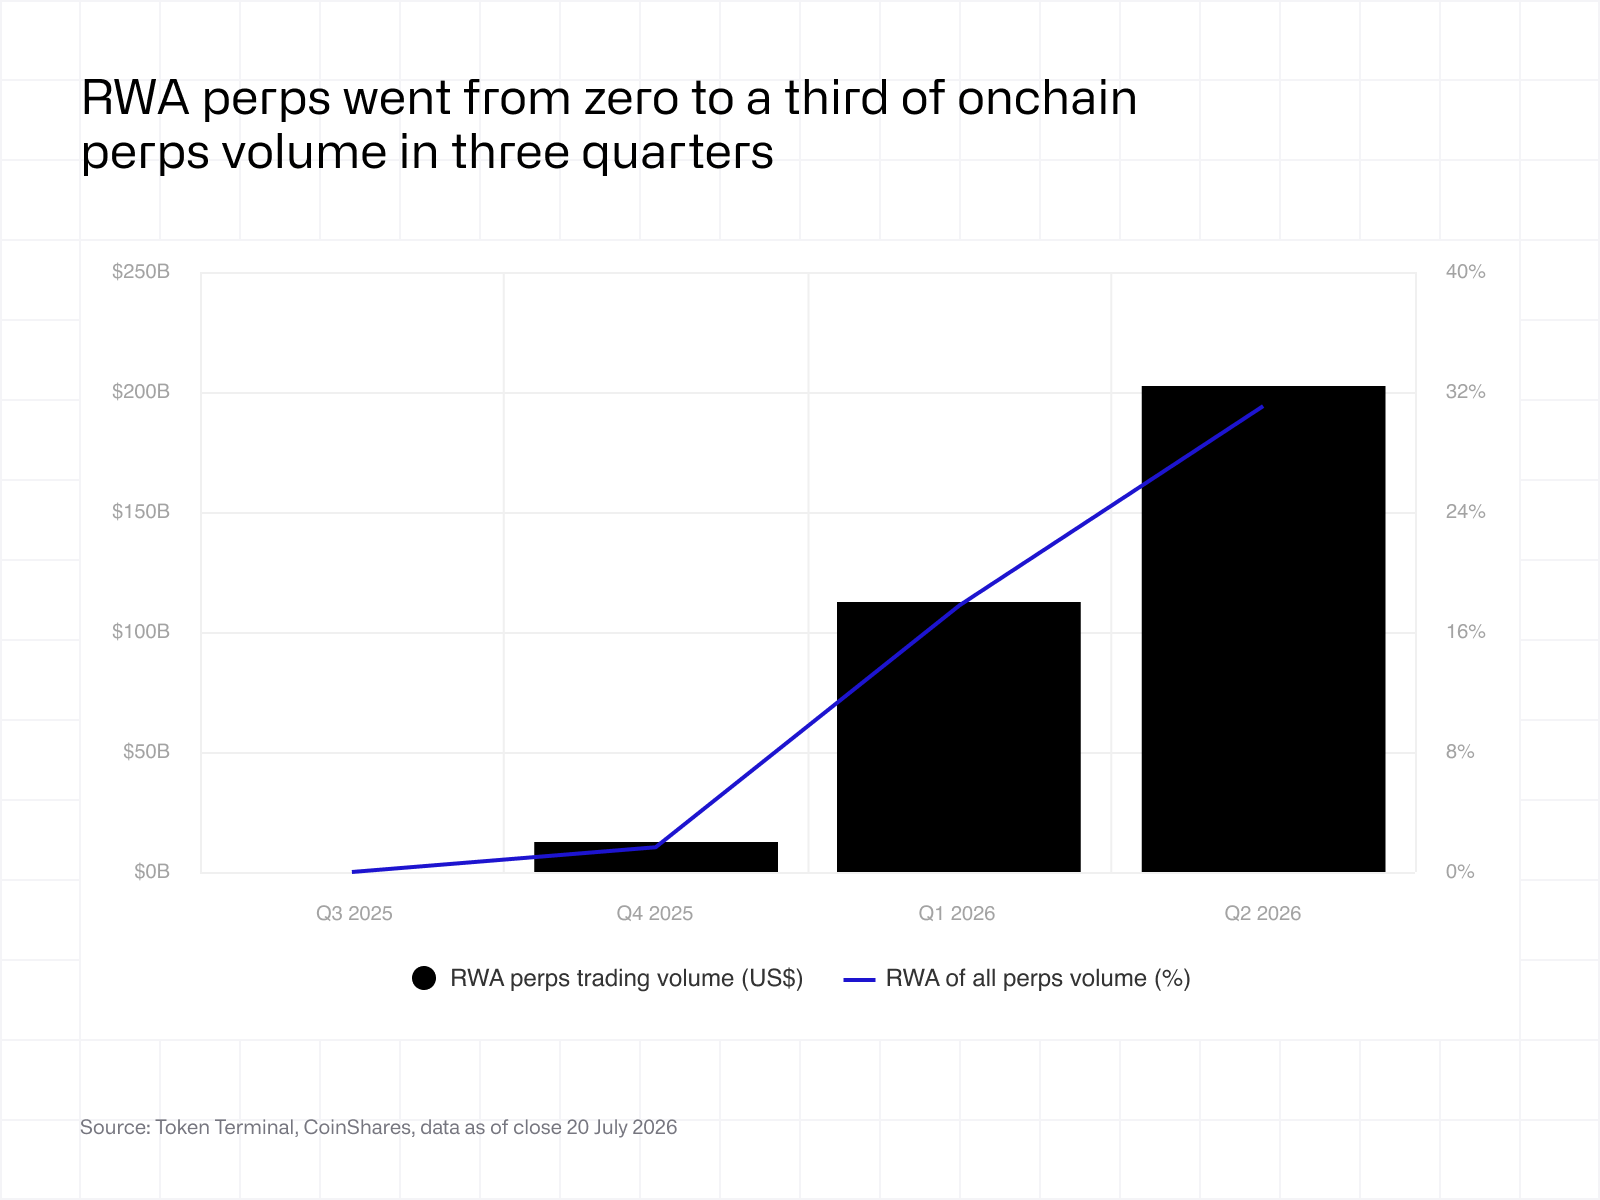 Perpetual futures are the next stage of market development after spot trading. While lending uses tokenised assets as collateral and spot markets transfer ownership, perpetual futures typically use stablecoins as collateral while providing leveraged exposure to the price of an underlying real-world asset, such as an equity index, commodity, or individual stock. Trading volume therefore measures how actively investors are using on-chain markets to gain exposure to RWAs.
While trading volumes have declined across the broader on-chain perpetual futures market since 10 October 2025, RWA perpetual futures have continued growing rapidly. Volumes on tradeXYZ, an RWA-focused venue built on Hyperliquid, have increased approximately 20x since launch, contrasting with the broader slowdown in crypto-native markets.
The divergence suggests that RWA perpetual futures are attracting new demand rather than simply redistributing existing crypto trading activity. For investors, they provide continuous access to traditional asset markets without requiring ownership of the underlying asset.
3.2 Volume is driven by commodities and equity indexes
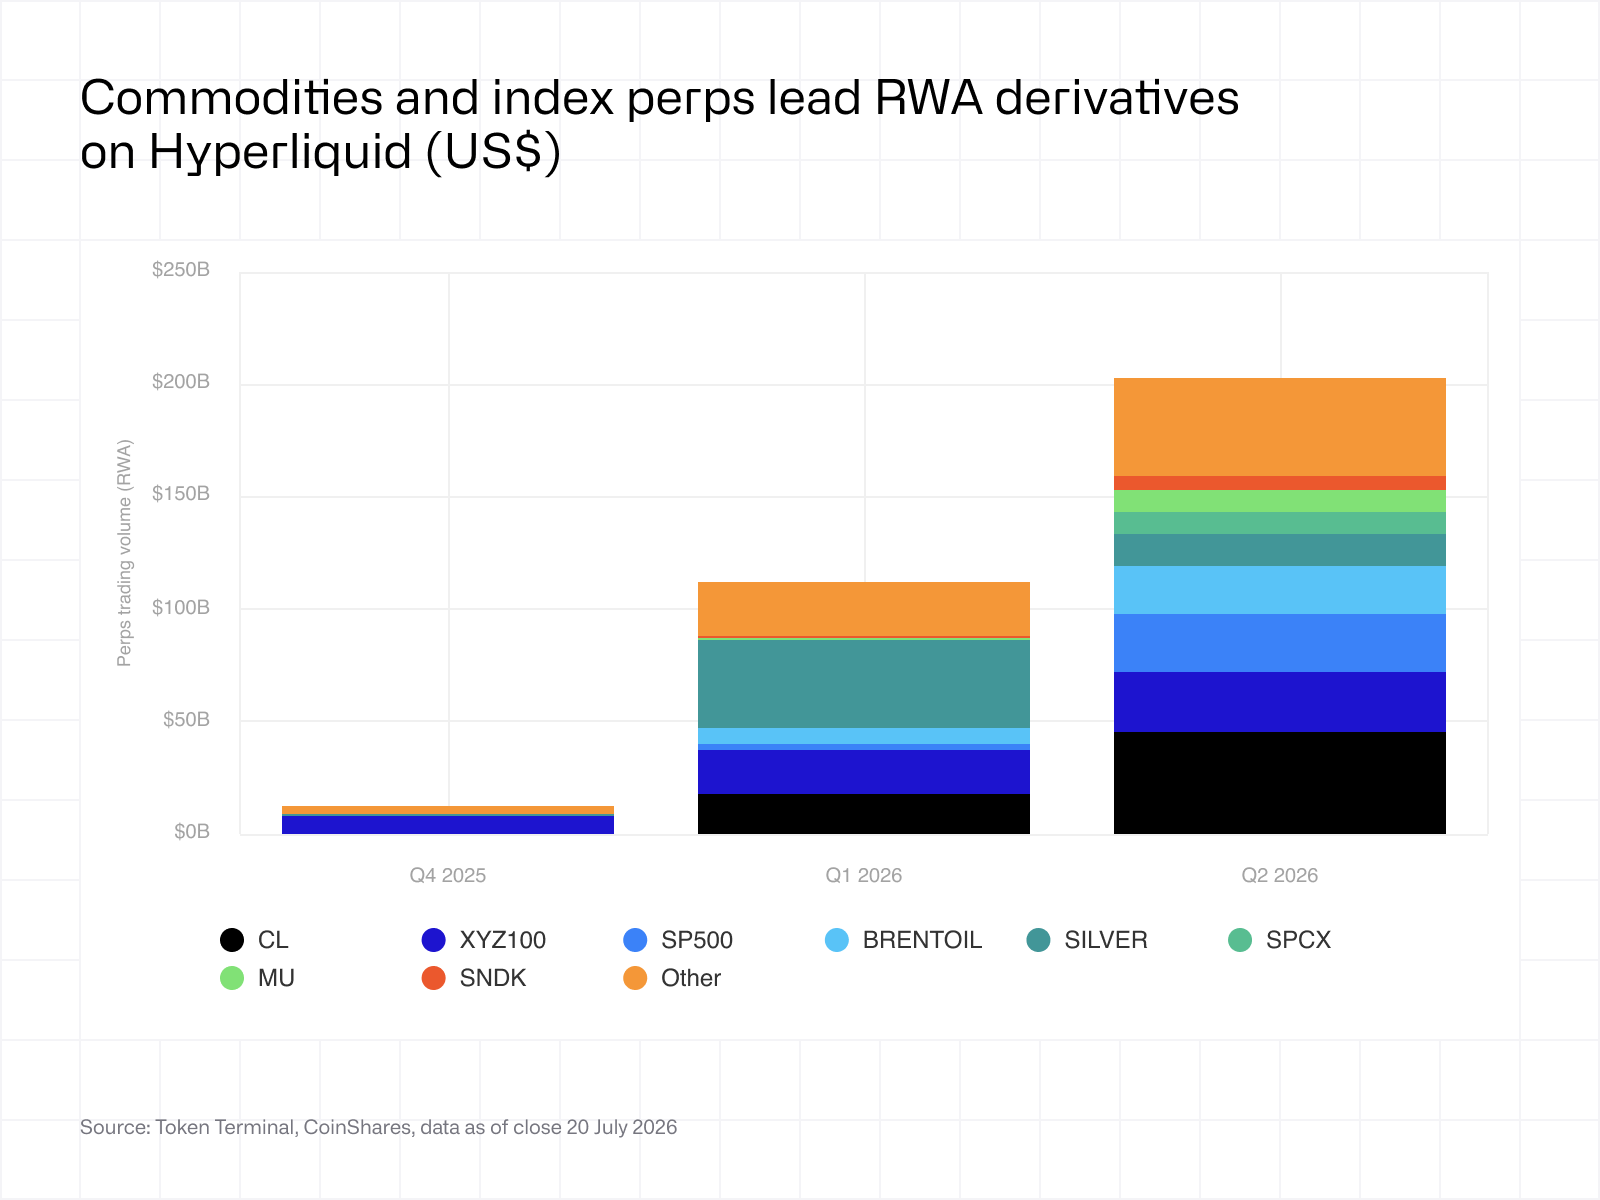 RWA perpetual futures volumes have been concentrated in commodities, equity indices, and technology and semiconductor stocks.
Oil and precious metals account for a large share of trading activity as investors increasingly respond to macroeconomic developments outside traditional market hours. Equity indexes, including the S&P 500 and Nasdaq-100, provide broad market exposure through a single instrument, while technology and semiconductor companies attract active trading because of their liquidity and price volatility.
The composition highlights where continuous trading provides the greatest value. Assets with frequent price discovery, global investor interest, and limited trading hours in traditional markets are naturally among the first to attract on-chain derivatives liquidity.
3.3 RWA open interest grows YoY despite DeFi downturn
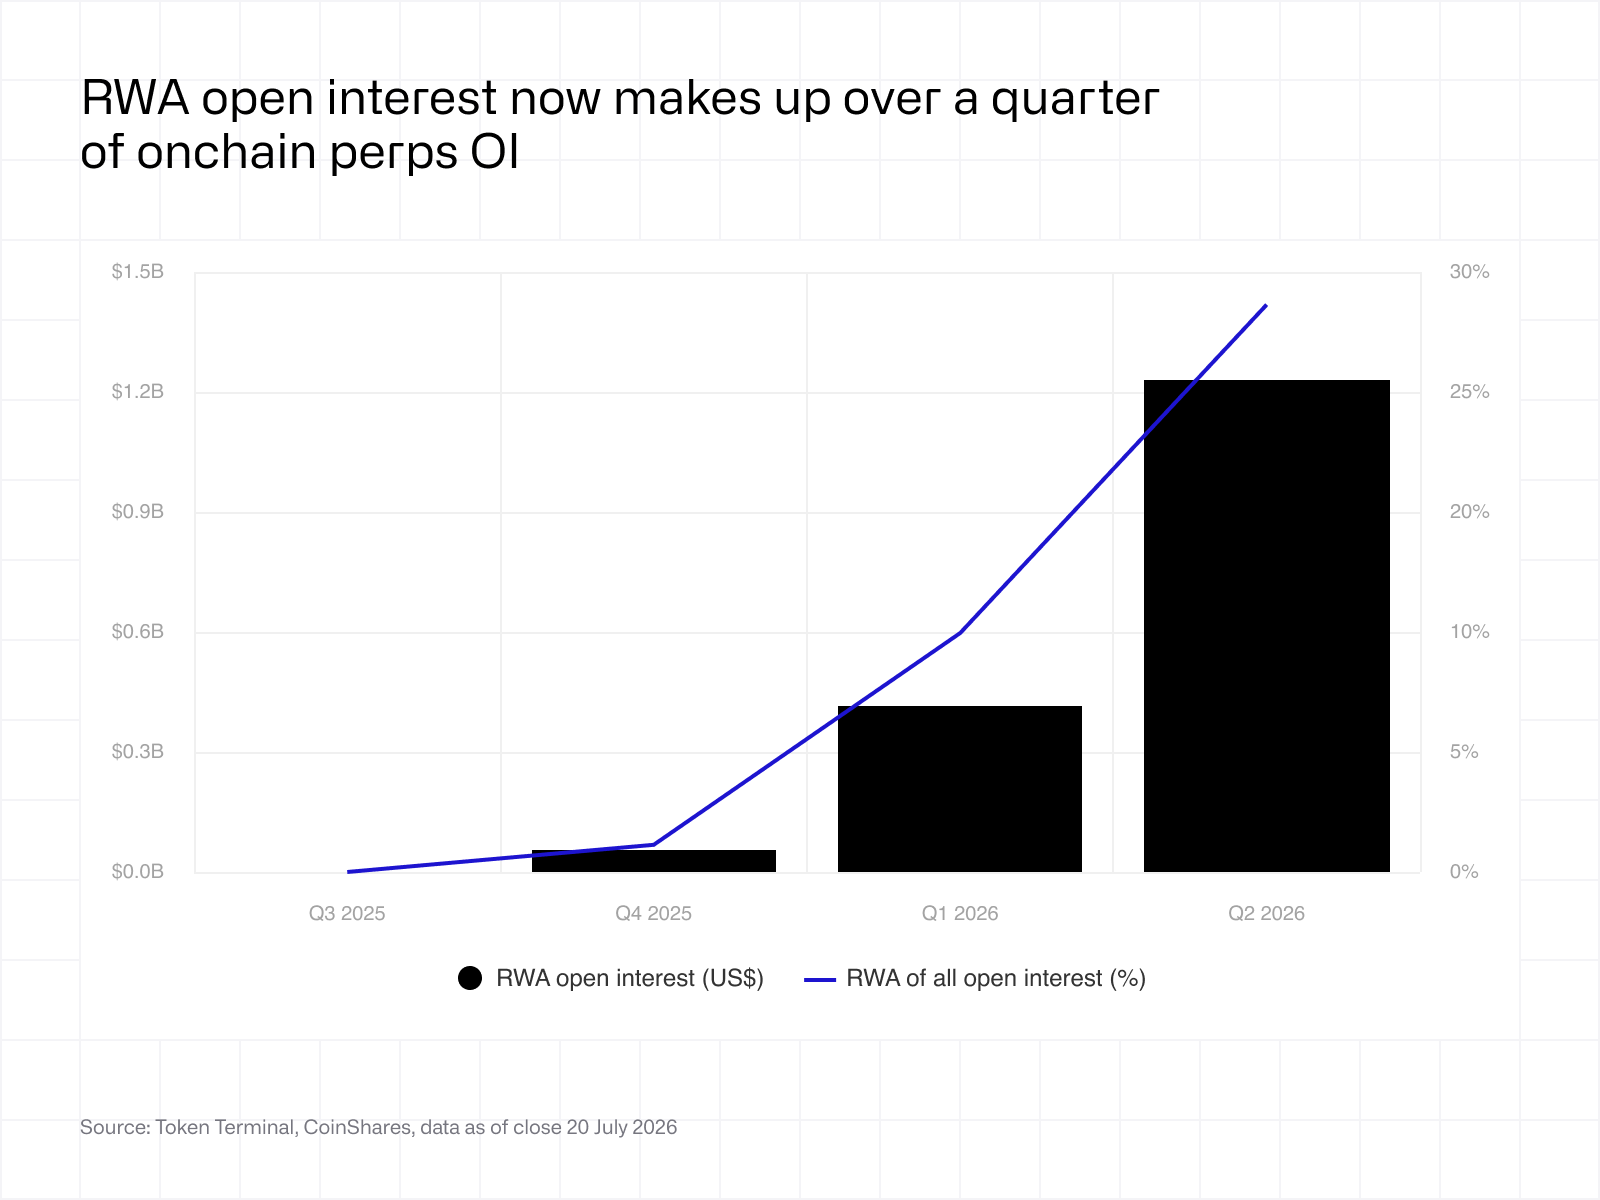 While trading volume measures activity, open interest measures committed capital. It represents the notional value of outstanding positions and therefore complements trading volume when assessing the development of RWA perpetual futures markets.
Open interest has continued growing despite the broader decline in crypto-native perpetual futures activity, indicating that investors are committing increasing amounts of capital to RWA perpetual futures rather than simply generating higher trading turnover.
This distinction is particularly useful when comparing derivatives markets. Trading volume can increase rapidly in the short-term as a result of trader and/or market maker incentives, whereas sustained growth in open interest indicates that capital remains deployed, supporting deeper and more durable markets.
3.4 Open interest is driven by equity indexes and semiconductor stocks
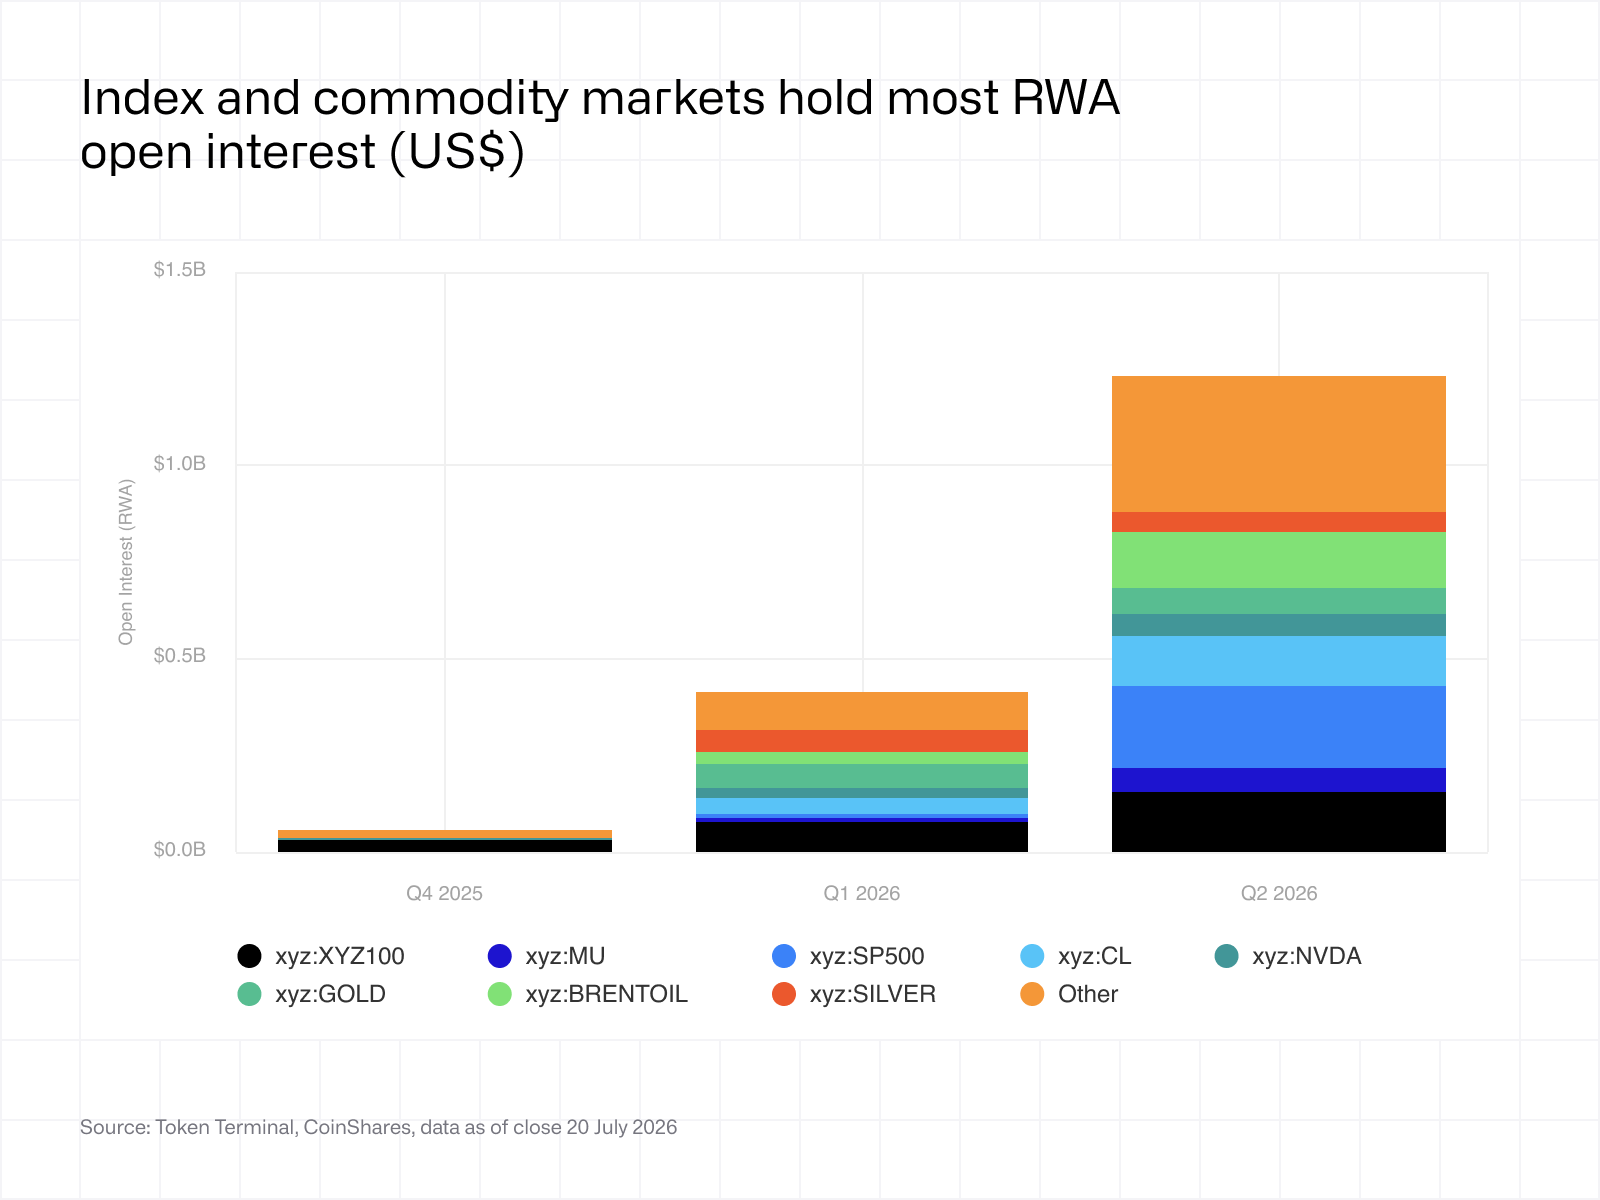 The composition of open interest broadly mirrors the trading volume breakdown, with equity indexes and semiconductor stocks accounting for the largest share of capital committed across RWA perpetual futures markets.
There are, however, notable differences between trading activity and capital allocation. While commodities generate a significant share of trading volume, equity indices and semiconductor stocks account for a larger share of open interest, suggesting that investors maintain larger or longer-lived positions in these markets. SK Hynix illustrates this dynamic, having rapidly become one of tradeXYZ's largest markets following its listing.
Together, the trading volume and open interest data suggest that RWA derivatives markets are becoming more established. Growth is increasingly supported by capital that remains committed to these markets rather than by short-term trading activity alone.
4. The business perspective
4.1 Revenues for on-chain lending and trading venues are down YoY
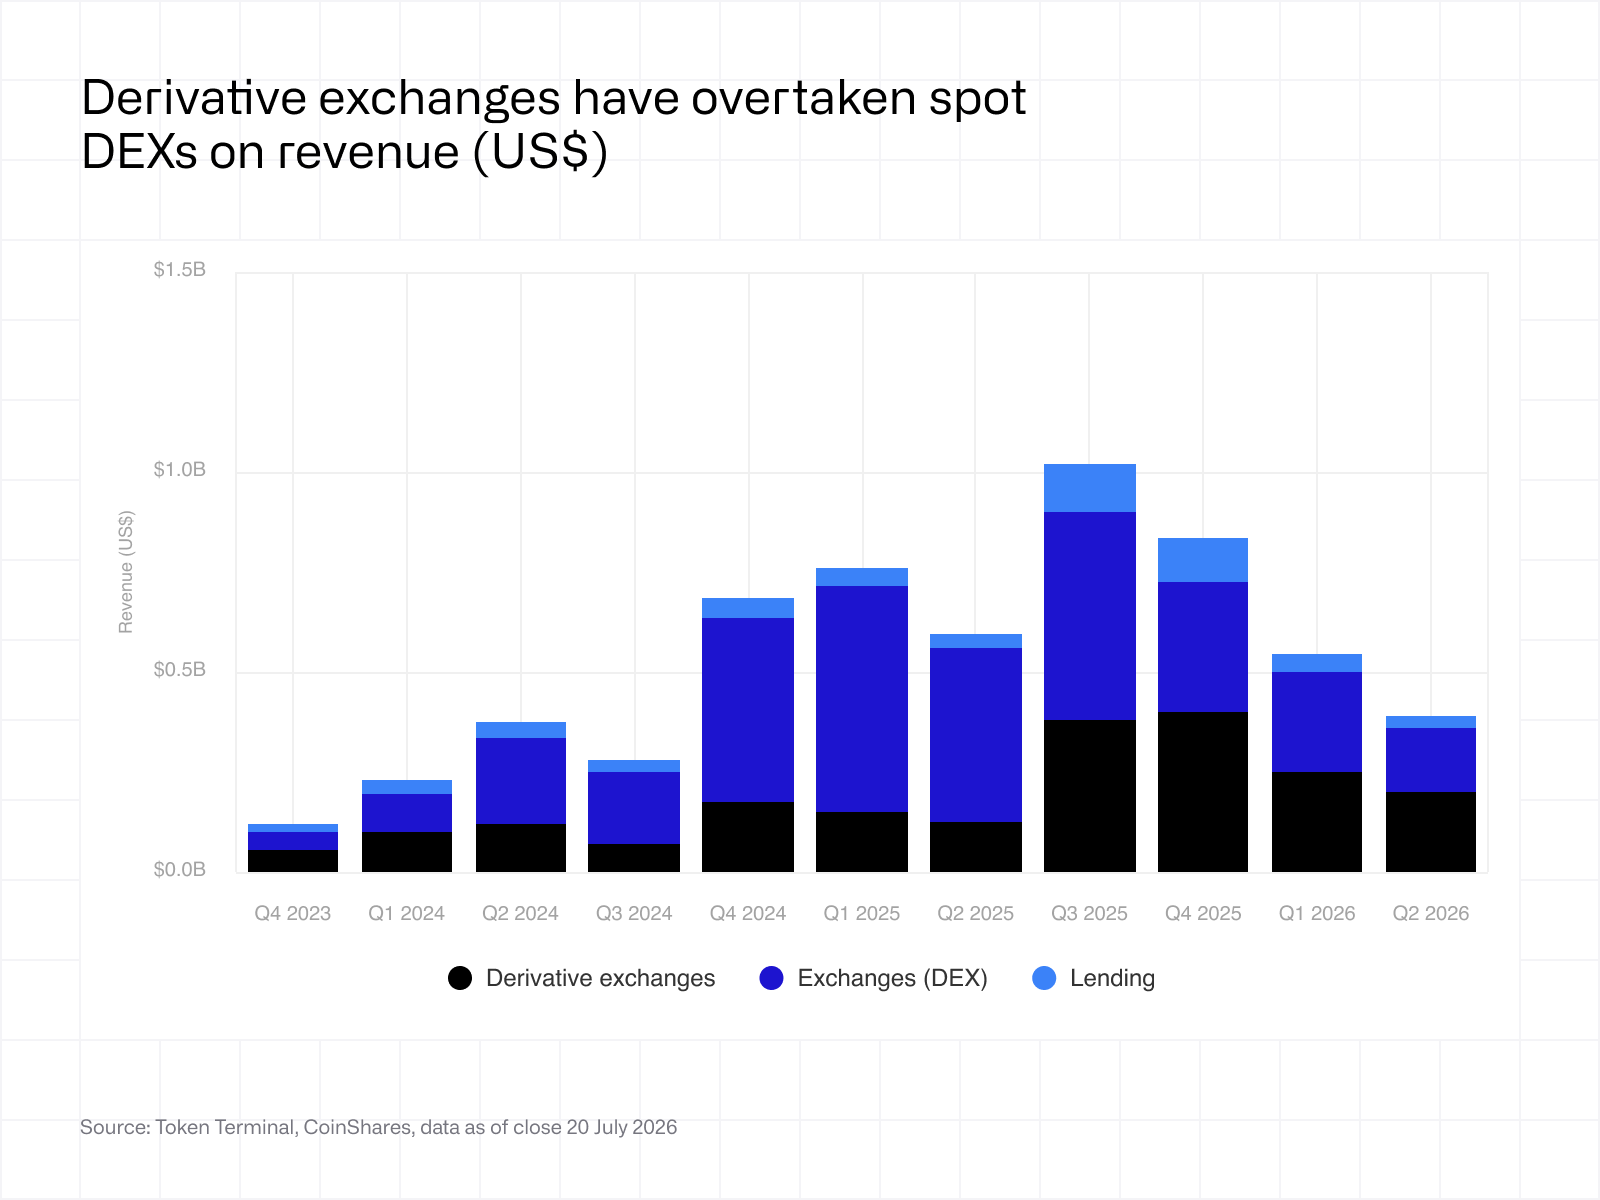 The previous sections showed that RWA lending and trading activity continued growing despite a broader slowdown across DeFi. The next question is whether that growth has begun translating into higher revenues for the venues facilitating the activity.
Application revenues declined across both lending and trading venues between Q2 '25 and Q2 '26. While RWA-related activity continued expanding, it remains small relative to crypto-native markets, meaning that lower trading and borrowing activity across the broader ecosystem continues to drive overall revenues.
This illustrates that RWA adoption is still in its early stages from a business perspective. Although lending and trading volumes continue growing, they have not yet reached the scale required to materially change the revenue trajectories of the largest on-chain financial applications.
4.2 Hyperliquid leads in absolute application revenue
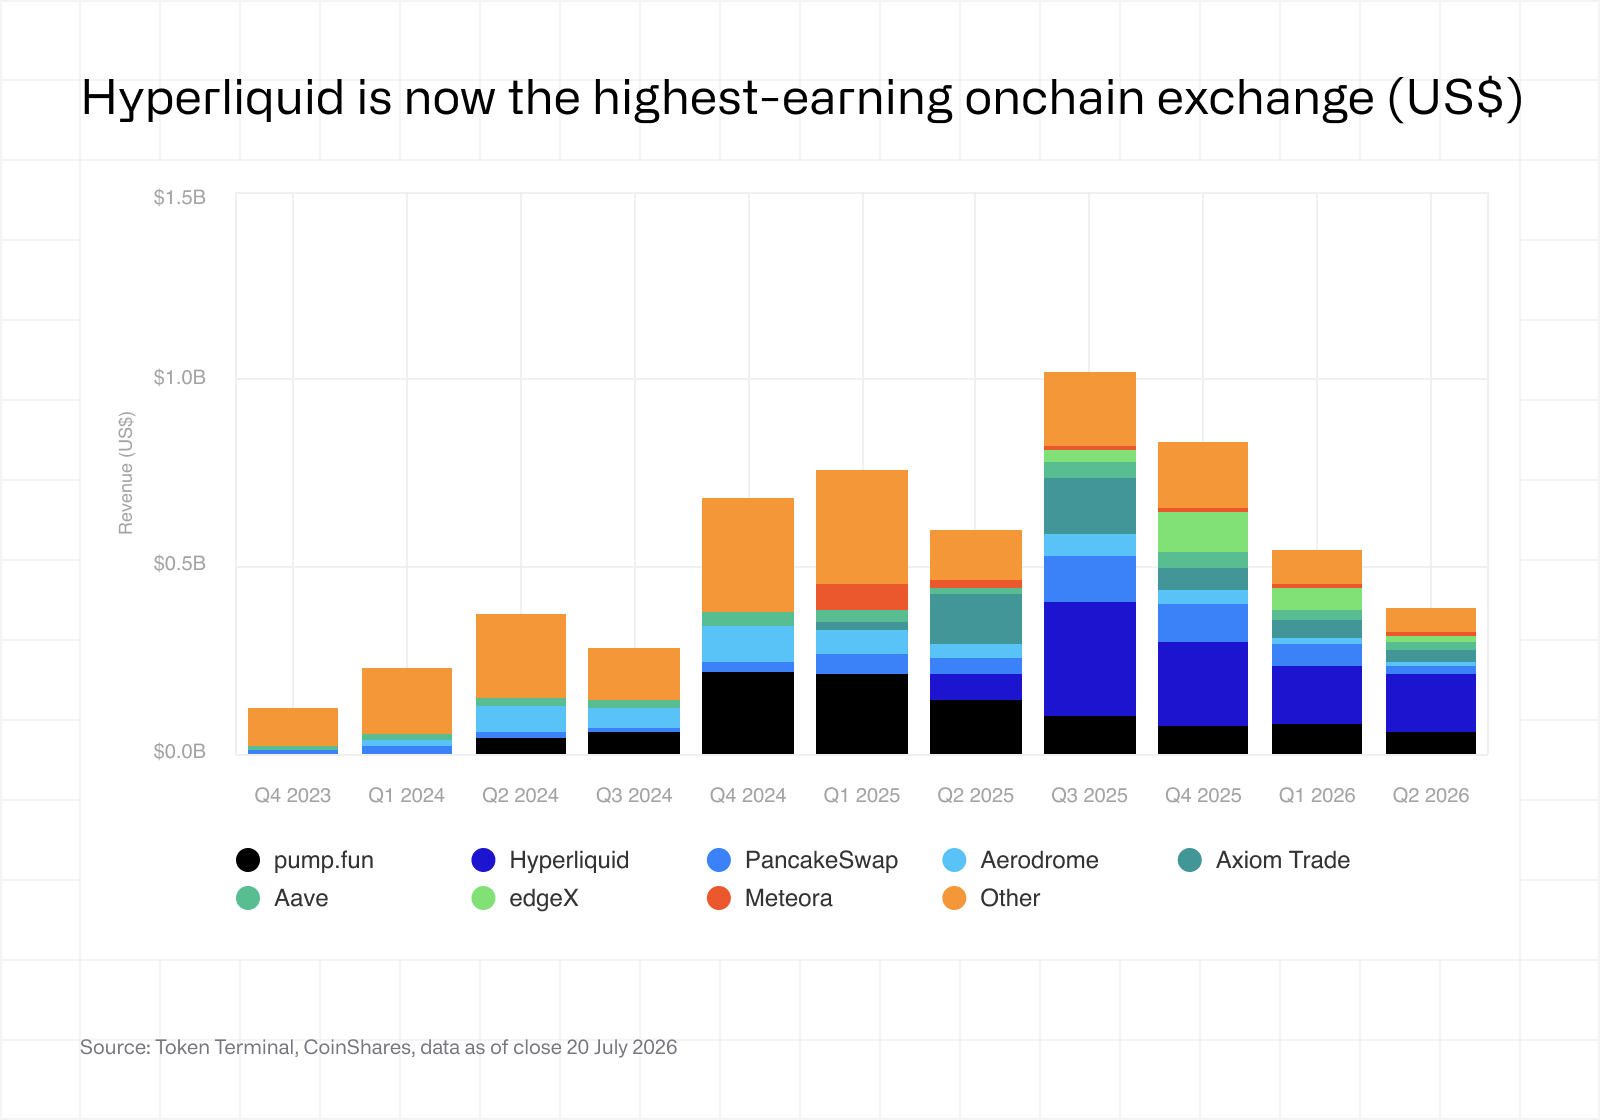 The revenue breakdown highlights a clear market leader. Despite lower revenues across the sector, Hyperliquid continues to generate substantially more application revenue than any other lending or trading venue.
The gap reflects both the scale of trading activity on the platform and the economics of derivatives exchanges, where high trading frequency translates into recurring transaction fees.
By comparison, lending revenues remain constrained by lower borrowing demand and, in the case of Morpho, the second-largest lending platform in the market, the absence of a protocol-level take rate.
The revenue distribution demonstrates that activity remains concentrated among a relatively small number of applications. As RWA markets expand, the largest venues are well positioned to capture a disproportionate share of additional trading and lending activity.
4.3 Hyperliquid competes at both the application and settlement layer
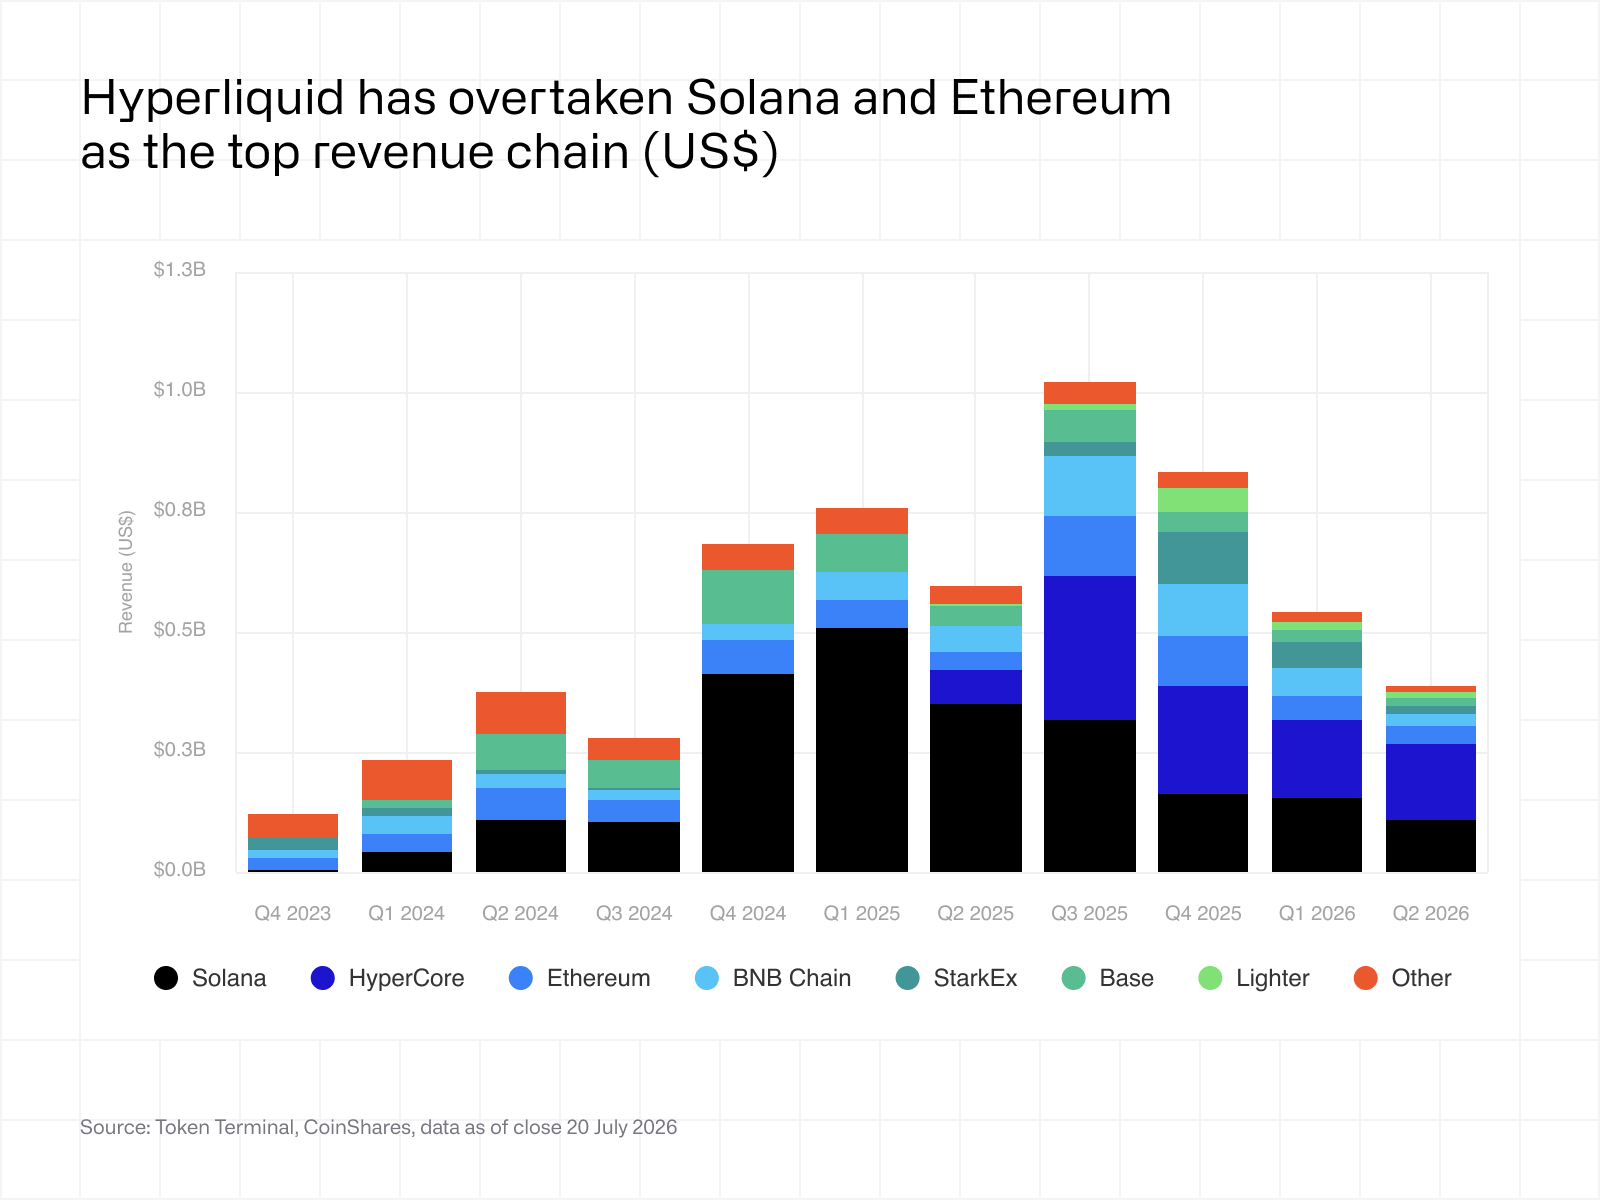 The previous chart compared revenues generated by individual applications. This chart attributes those revenues to the underlying settlement networks, highlighting where economic activity ultimately accrues.
Hyperliquid stands apart because it competes at both the application and settlement layer. Unlike most trading venues, which generate fees while settling on third-party blockchains, Hyperliquid captures value from both the exchange and the infrastructure supporting it.
The chart also highlights the importance of performance. Hyperliquid and Solana account for a disproportionate share of application revenues, suggesting that low latency and high throughput remain important competitive advantages for on-chain trading venues.
4.4 Trading venues are assigned the highest revenue multiples
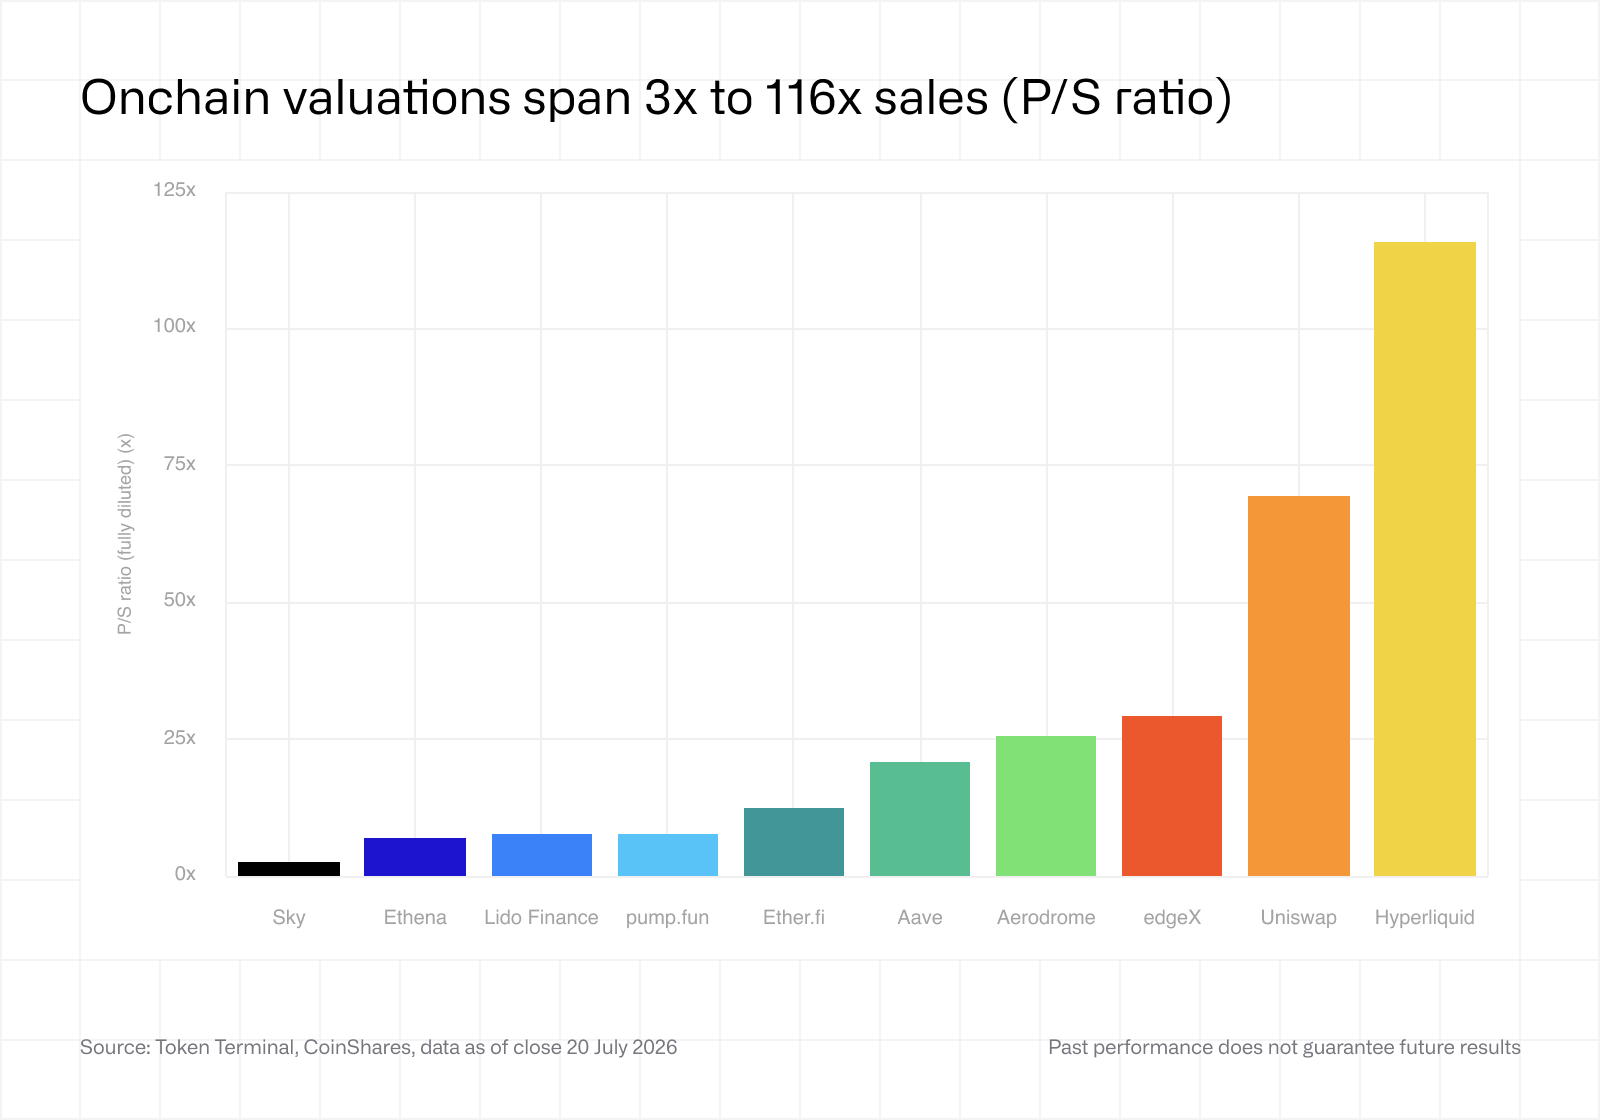 The final chart compares the valuation multiples assigned to leading on-chain financial applications. Trading venues, including Hyperliquid, Uniswap, and Aerodrome, command the highest revenue multiples in the group.
Higher valuation multiples generally reflect expectations of stronger future cash flow growth. Compared with lending or asset management businesses, trading venues benefit from higher capital velocity, broader product expansion opportunities, and operating models that scale efficiently as trading activity increases.
As Hybrid Finance develops, leading on-chain financial applications are increasingly likely to be evaluated using the same valuation frameworks as traditional financial services businesses. Revenue multiples therefore provide another lens through which investors assess the long-term economics of the sector.
Note: Valuation multiples are calculated using fully diluted market capitalisation. This reflects the value of the protocol's full ownership base rather than only the tokens currently in circulation, providing a more comparable basis across projects with different token distribution schedules. This is analogous to traditional equity valuation, where companies are compared based on total shares outstanding rather than free float.
5. Yield and usage
5.1 Each RWA has a distinct risk and return profile
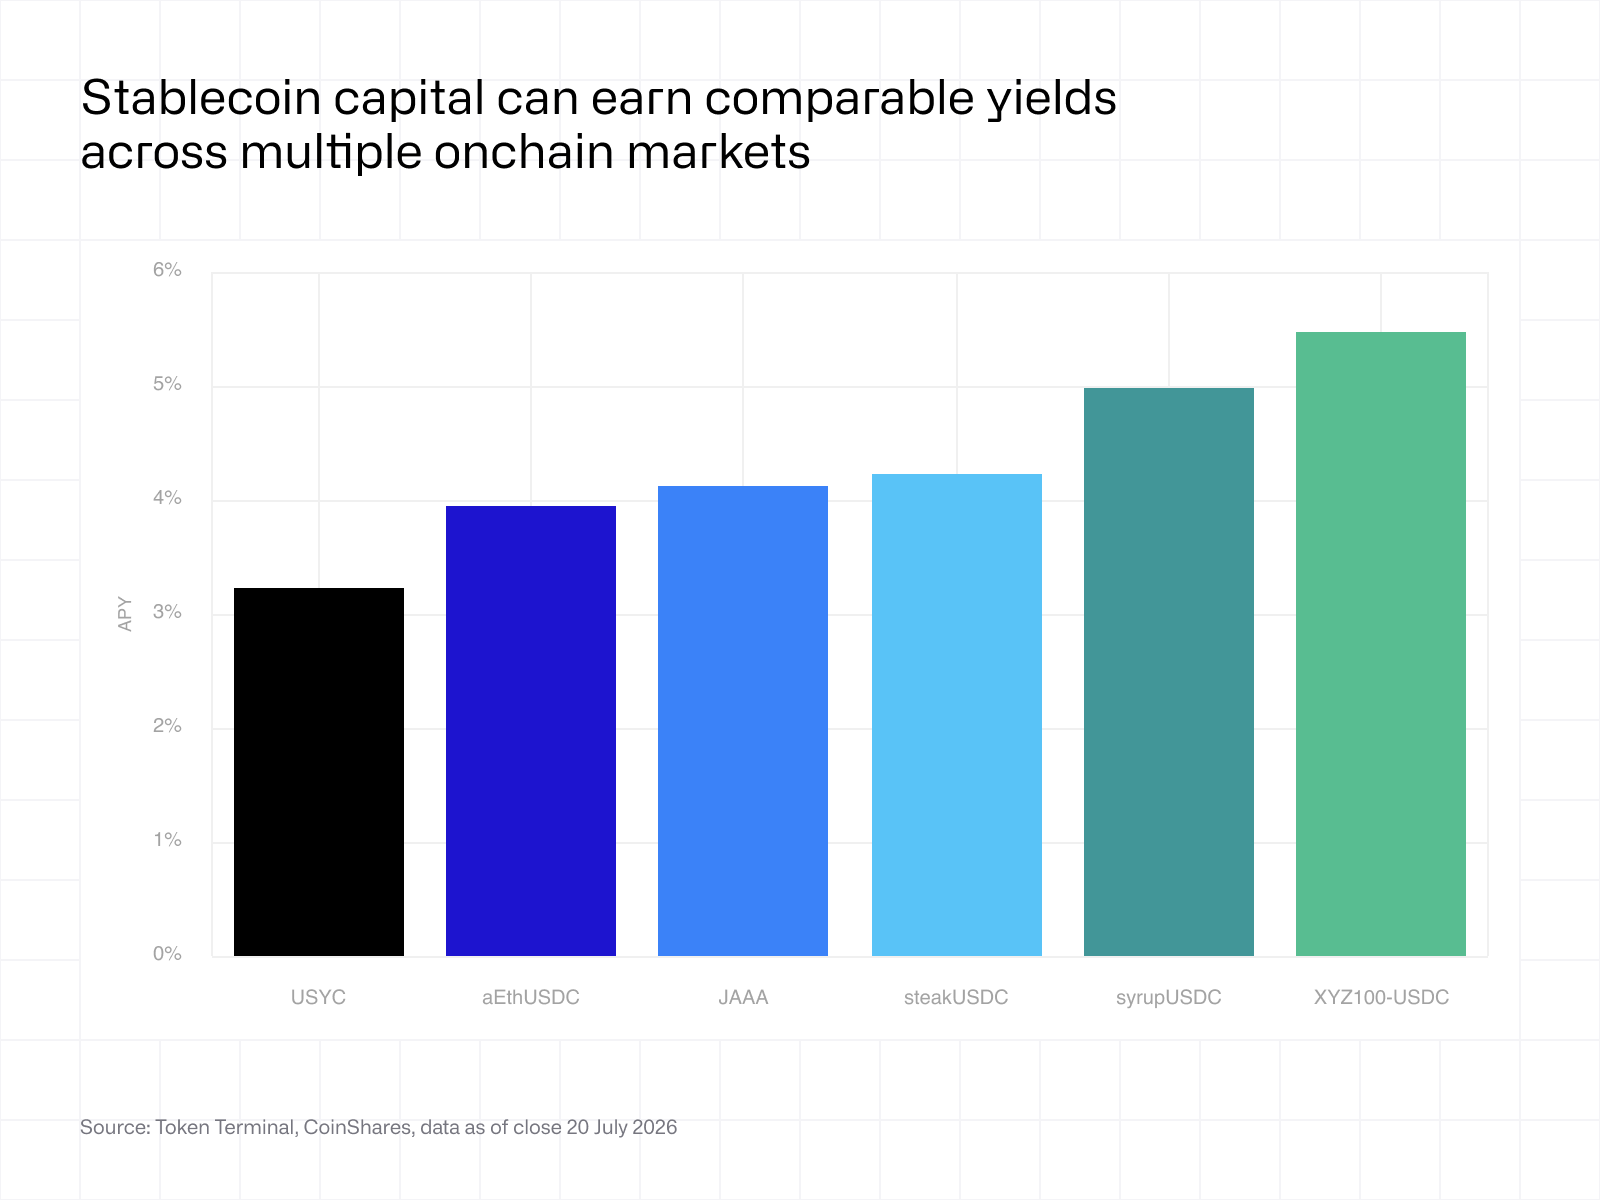 The previous chapter examined the businesses facilitating Hybrid Finance. This chapter turns to the products themselves, beginning with the relationship between risk, return, and investor demand.
The chart shows that yields currently range from approximately 3.2% to 5.5%, reflecting different underlying sources of return. Tokenised Treasury funds sit at the lower end of the range, while private credit, on-chain lending markets, vaults, and funding rate strategies offer progressively higher yields alongside different risk profiles.
The dispersion illustrates that tokenised assets are evolving beyond simple Treasury products. As the market matures, investors are increasingly able to select products that match their preferred balance between yield, risk, and liquidity.
Note: For comparability, all yields are presented from the perspective of a stablecoin holder allocating capital across different on-chain income strategies. In the case of funding rate strategies, this assumes a delta-neutral position in which exposure to the underlying asset is hedged, isolating funding payments as the primary source of return. This allows funding rate strategies to be compared with Treasury, private credit, and lending products as alternative ways of generating yield on stablecoin-denominated capital.
5.2 Holder types differ meaningfully between different RWAs
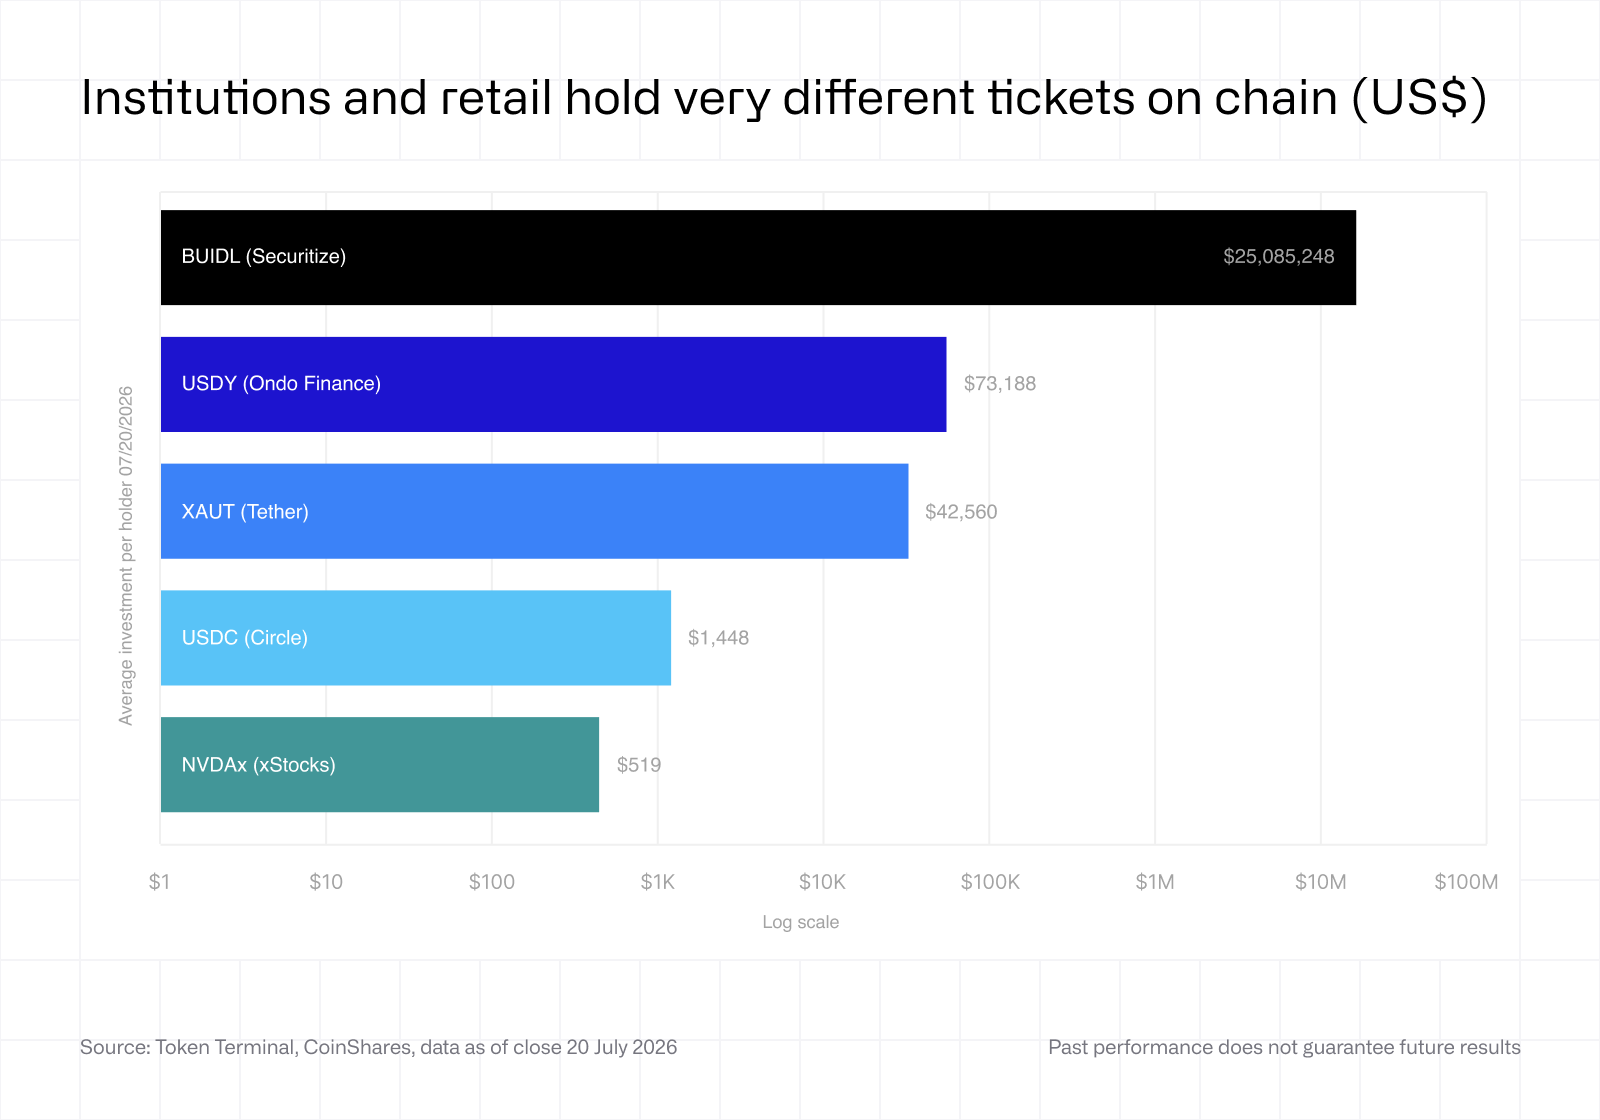 Different products attract different types of investors. One way to approximate this is by comparing the average wallet balance per holder, calculated as assets under management divided by the number of on-chain holders.
The differences across products are substantial. Institutional products such as BlackRock’s BUIDL, issued by Securitize, have average wallet balances measured in the tens of millions of dollars, while tokenised equities issued through xStocks are held in much smaller balances consistent with broad retail participation.
Although individual wallets do not necessarily represent individual investors, the metric provides a useful indication of the investor segment each product primarily serves. Together with yield, investor composition helps explain why different RWA categories develop along different adoption paths.
5.3 Retail-focused RWAs are growing their holder bases faster
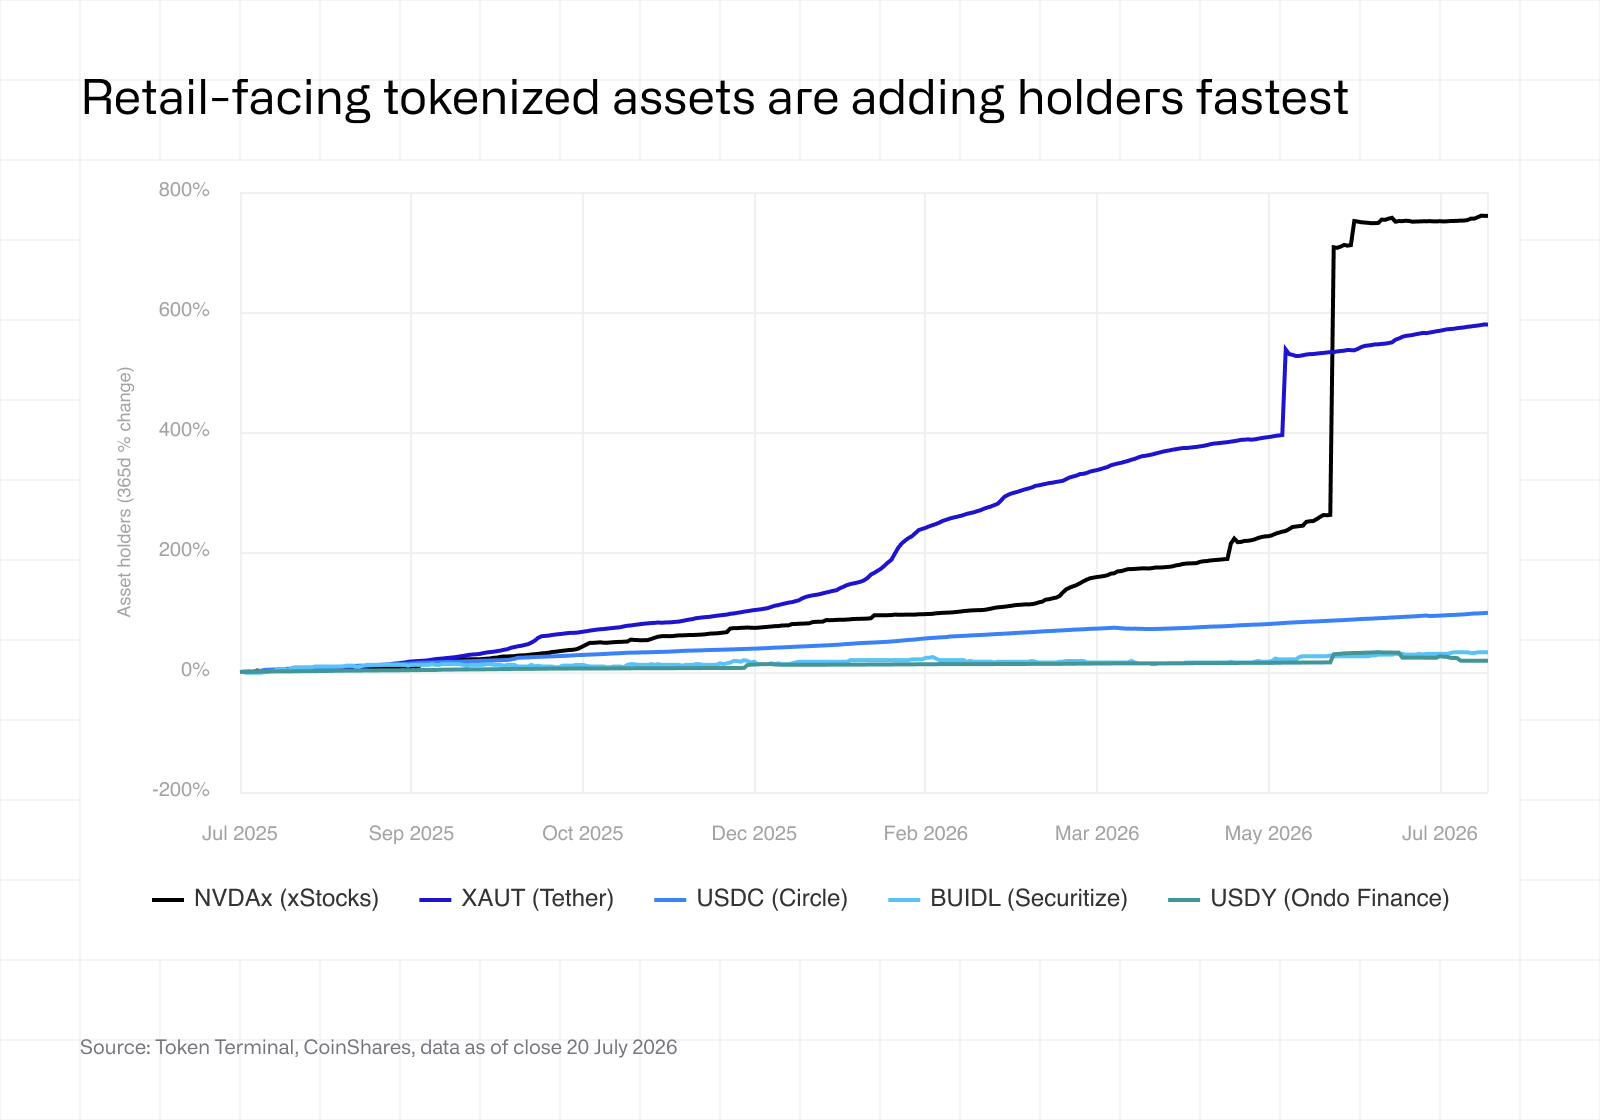 Investor participation also differs markedly across RWA categories. Products designed for retail investors have generally expanded their holder bases more rapidly than products targeting institutional capital.
The chart shows that tokenised equities have experienced the fastest growth in on-chain holders over the past year, substantially outpacing institutional products. Lower minimum investment sizes allow a broader group of investors to participate, accelerating holder growth even when the amount of capital invested per holder remains relatively small.
The comparison highlights that user growth and capital growth measure different dimensions of adoption. Institutional products may attract larger allocations, while retail-focused products typically expand their user bases more quickly.
5.4 Tokenised stocks today resemble stablecoins in 2019
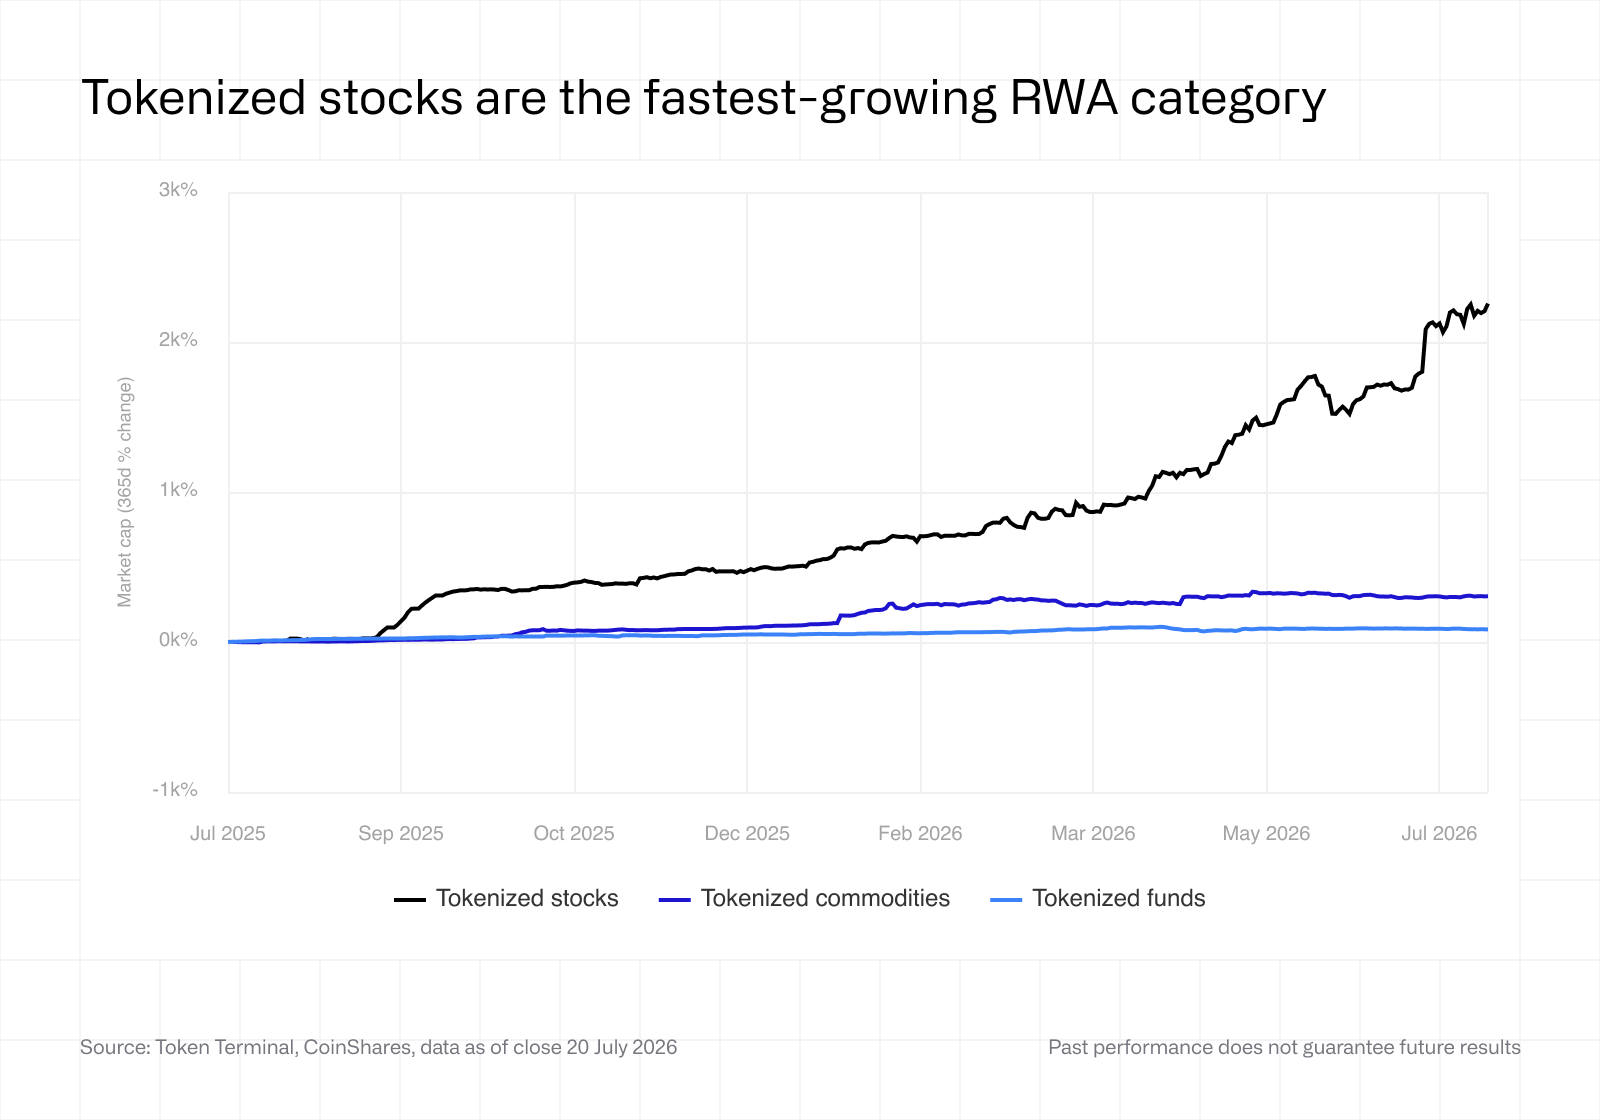 The previous sections showed that tokenised equities are attracting the fastest-growing user bases. The final chart places that growth into a broader market context.
Although all RWA categories continue expanding, tokenised stocks have grown considerably faster than tokenised funds and commodities, albeit from a much smaller base. Despite this momentum, only around $2.2 billion of an addressable global equity market of over $100 trillion has been tokenised to date.
The comparison with USD stablecoins in 2019 illustrates the market's current stage of development rather than its eventual outcome. Both markets began with modest adoption relative to their addressable opportunity before entering periods of sustained infrastructure investment, product development, and user growth.
Future outlook
Taken together, these trends point to a market whose next phase will be defined less by the amount of assets that are tokenised than by how they are used.
Utility. Tokenised assets continue growing independently of broader DeFi activity, both as collateral and across trading venues. As additional asset classes move on-chain, demand is increasingly likely to be driven by financial utility rather than by crypto market cycles alone.
Consolidation. Lending activity, trading volumes, and application revenues remain concentrated among a relatively small number of assets, venues, and ecosystems. This reflects the importance of liquidity, network effects, and operating history. While new participants will continue entering the market, the largest platforms are well positioned to strengthen their competitive positions as activity scales.
Monetisation. RWA lending and trading activity has not yet materially changed the revenue profile of the largest on-chain financial applications. However, if tokenised asset markets continue expanding faster than crypto-native markets, RWA-related activity is likely to become an increasingly important driver of application revenues over time.
Specialisation. The market is becoming increasingly segmented by investor type. Institutional investors continue allocating capital to yield-bearing collateral products, while retail participation is growing most rapidly through tokenised equities. As product breadth expands, investor segmentation is likely to become more pronounced rather than less.
Product innovation. Tokenised assets are evolving beyond simple Treasury products towards a broader range of risk and return profiles. As issuers compete for capital, differentiation is increasingly likely to come from product design, yield generation, and access to previously unavailable investment opportunities, rather than tokenisation alone.
Published onAug 6th, 2026
