
Introduzione a Hyperliquid e quadro di valutazione a 5 anni
![]() 42 minuti di lettura
42 minuti di lettura
- Ethereum
- Altcoins
1. Sintesi
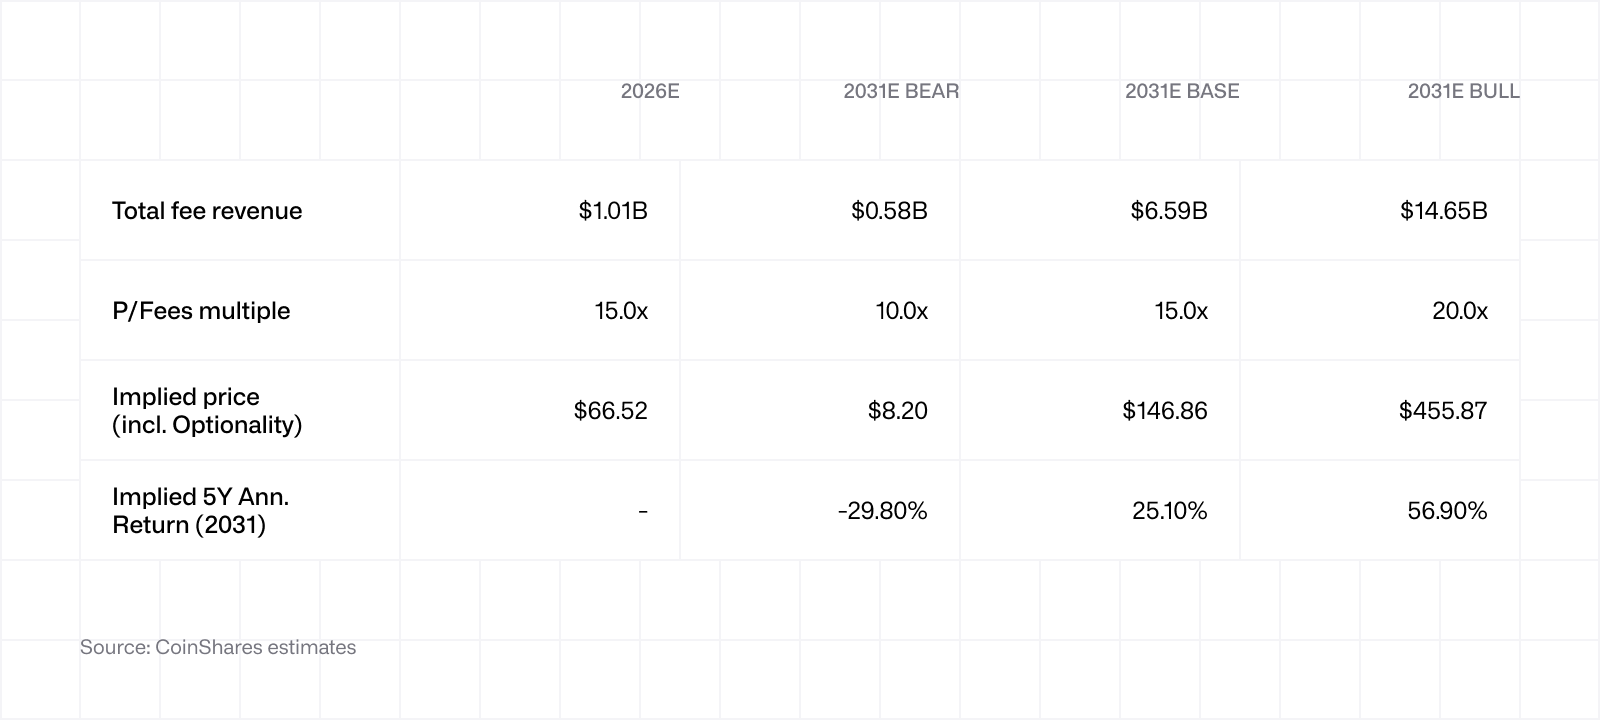
Valutiamo HYPE utilizzando un modello basato sui multipli P/Fees (Prezzo/Commissioni) applicato a sette flussi di ricavi, proiettati in scenari bear, base e bull su un orizzonte temporale di cinque anni. I principali risultati sono i seguenti:
Bear: prezzo implicito di circa 8 $ entro il 2031, con un rendimento annualizzato del -30% rispetto al prezzo spot attuale.
Base: prezzo implicito di circa 147 $ entro il 2031, con un rendimento annualizzato del +25%.
Bull: prezzo implicito di circa 456 $ entro il 2031, con un rendimento annualizzato del +57%.
HYPE è uno dei pochi cripto-asset per i quali l’utilizzo della rete si traduce in maniera quasi immediata in domanda per il token sottostante. Il 99% delle commissioni di negoziazione provenienti dal protocollo sottostante viene trasferito in un Assistance Fund che riacquista HYPE sul mercato ogni giorno. Ad oggi sono stati acquistati circa 44,4 milioni di HYPE, per un valore di circa 2,2 miliardi di dollari ai prezzi attuali. Il meccanismo ha un funzionamento simile a quello del buyback azionario da parte di una società, ma viene eseguito in modo trasparente, on-chain e a un ritmo che varia in base all’attività della piattaforma anziché a discrezione. In questo contesto sono rari gli asset comparabili in grado di generare un valore così elevato direttamente per i propri possessori.
La metodologia utilizzata nel presente report prevede l’applicazione di un multiplo P/Fees ai ricavi previsti relativi a contratti perpetui, operazioni spot, aste HIP-1, contratti perpetui tokenizzati HIP-3, mercati predittivi HIP-4, HyperEVM e rendimento della riserva USDC AQAv2 (questi termini verranno spiegati più avanti).
Gli stessi multipli sono basati sull’andamento effettivo delle negoziazioni di HYPE. Sulla base del rapporto P/Fees calcolato sull’offerta circolante, negli ultimi 12 mesi HYPE ha oscillato tra circa 7x e 25x, con una media di circa 12x. Gli scenari bear, base e bull sono stati fissati rispettivamente a 10x, 15x e 20x. Nessuno di questi scenari richiede un’espansione dei multipli rispetto ai livelli attuali.
2. Che cos’è Hyperliquid?
Hyperliquid, come spiegato dalla fondazione che l’ha creata, è “la blockchain destinata a ospitare l’intero settore finanziario” . In termini più semplici, si tratta di una blockchain Layer-1 ad alte performance, progettata appositamente per lo scambio di contratti perpetui on-chain. Gli utenti possono scambiare una vasta gamma di asset attraverso order book completamente on-chain, tra cui criptovalute, asset reali, azioni pre IPO e, più recentemente, mercati predittivi.
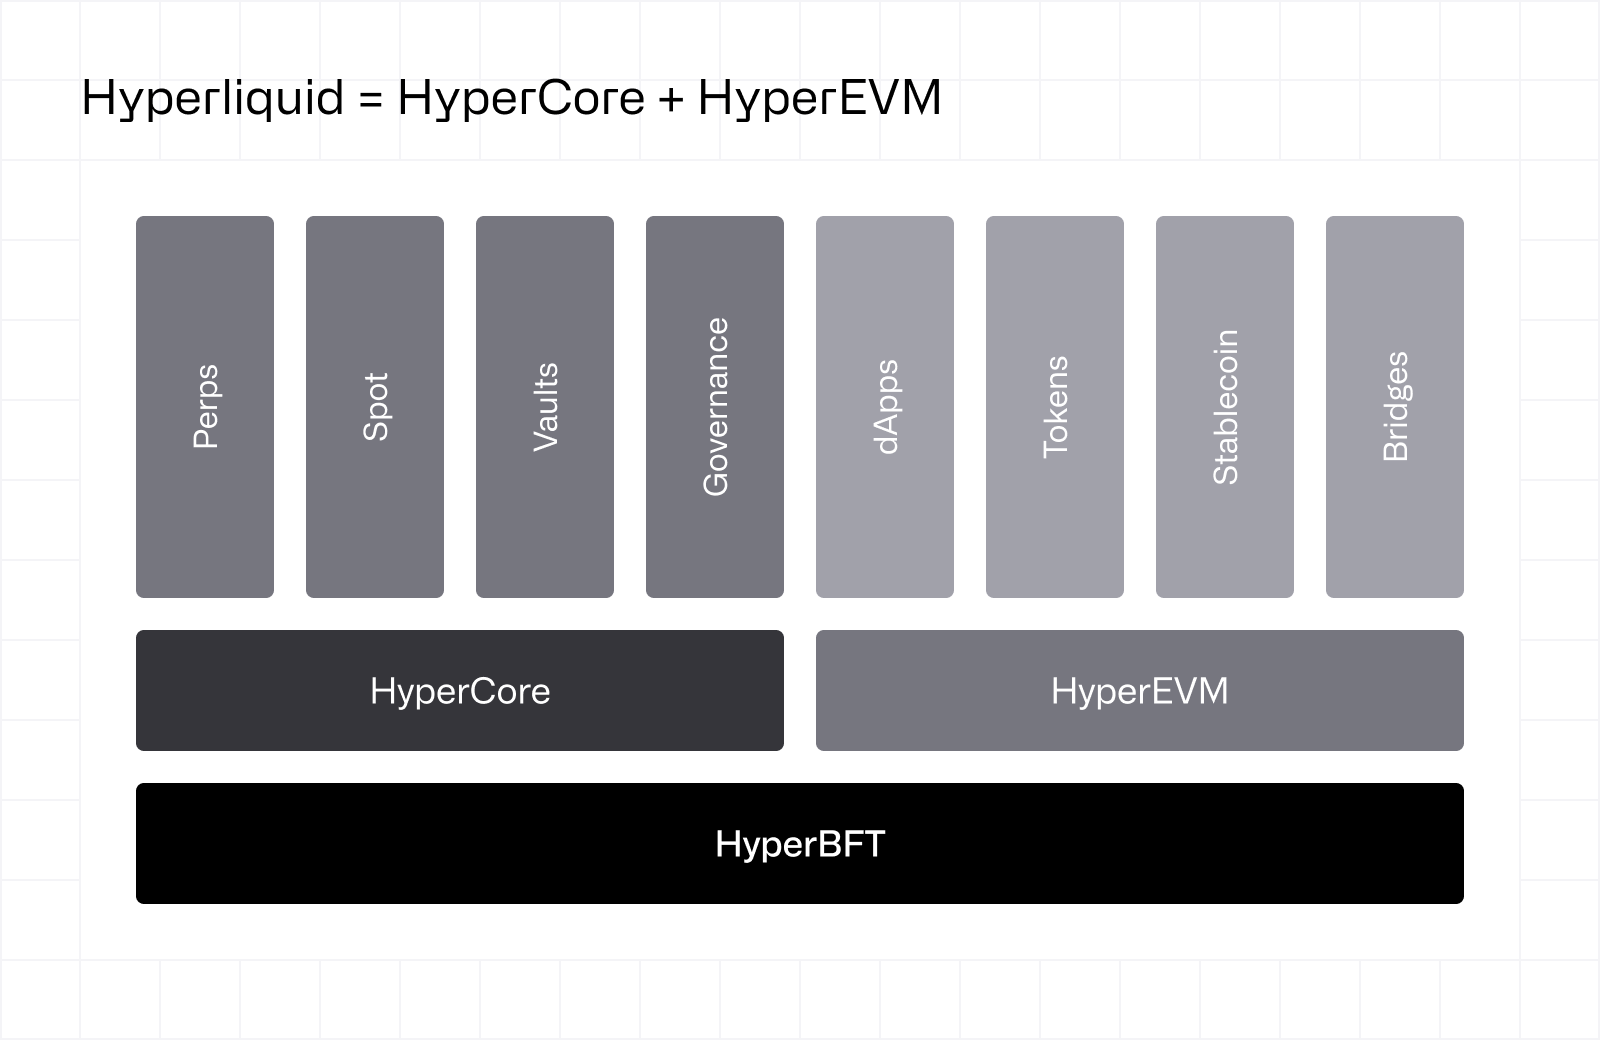 Il precedente diagramma descrive a grandi linee l’architettura di Hyperliquid.
HyperBFT è il meccanismo di consenso alla base della blockchain. BFT, che sta per Byzantine Fault Tolerance, indica che la rete è in grado di continuare a funzionare anche nel caso in cui alcuni validatori smettano di operare o agiscano in modo malevolo.
HyperBFT completa la catena e mette in ordine le transazioni. Questo processo è garantito da un gruppo di validatori che ricevono ricompense (un APY di circa il 2,1%) in cambio dei loro servizi.
Al di sopra si trovano due ambienti di esecuzione: HyperCore e HyperEVM.
HyperCore è la piattaforma che ospita lo scambio dei contratti perpetui. Ogni ordine, cancellazione, scambio e liquidazione avviene qui, in maniera trasparente e con finalizzazione in meno di un secondo. Può supportare fino a 200.000 ordini al secondo, performance simili a quelle di un exchange centralizzato, ma completamente on-chain. HyperCore contiene contratti perpetui, mercati spot, vault che permettono agli utenti di destinare fondi a strategie di negoziazione, nonché il modulo di governance che disciplina aspetti quali i parametri relativi alle commissioni e le HIP (Hyperliquid Improvement Proposals).
HyperEVM è il layer di smart contract a uso generico. EVM sta per Ethereum Virtual Machine, il che significa che HyperEVM è in grado di interpretare ed eseguire il codice scritto per Ethereum. Gli sviluppatori che hanno familiarità con strumenti di Ethereum come Foundry o Hardhat possono implementare contratti facilmente, semplificando così lo sviluppo su Hyperliquid. HyperEVM non è una blockchain separata. È protetta da HyperBFT, lo stesso meccanismo di consenso che protegge HyperCore. Qui si trova l’ecosistema più ampio: dApp come protocolli di prestito, token emessi attraverso aste HIP-1 e bridge che connettono Hyperliquid ad altre catene.
Hyperliquid ha fatto molta strada dal lancio della sua mainnet nel 2023, vantando alcuni sviluppi significativi che l’hanno resa la piattaforma leader che è oggi:
2023: lancio della mainnet con il DEX per i contratti perpetui, il prodotto di punta che ha promosso l’adozione iniziale.
2024: lancio delle aste per i ticker HIP-1, permettendo ai token di essere quotati sui mercati spot di Hyperliquid attraverso un meccanismo d’asta competitivo.
Febbraio 2025: lancio di HyperEVM, aprendo la piattaforma allo sviluppo di smart contract a uso generico e al più ampio ecosistema DeFi.
Ottobre 2025: HIP-3 introduce i contratti perpetui implementati dai builder, consentendo a chiunque di lanciare i propri mercati di contratti perpetui (azioni, materie prime, valute, indici) effettuando uno staking di 500.000 HYPE.
Maggio 2026: lancio dei mercati predittivi HIP-4, introducendo sulla piattaforma mercati predittivi interamente on-chain. Sebbene siano già operativi, si trovano ancora in una fase iniziale.
Hyperliquid ha suscitato grande interesse grazie a un’ottima esperienza utente, caratterizzata da spread e commissioni minime, elevata liquidity, trasparenza e, soprattutto, accesso a un’ampia varietà di mercati che offrono diversi livelli di leva finanziaria. La piattaforma è diventata un punto di riferimento importante per la copertura su larga scala, il trading direzionale e tutte ciò che sta nel mezzo.
1,2 milioni di utenti storici
Oltre 4.330 miliardi di dollari di volume storico
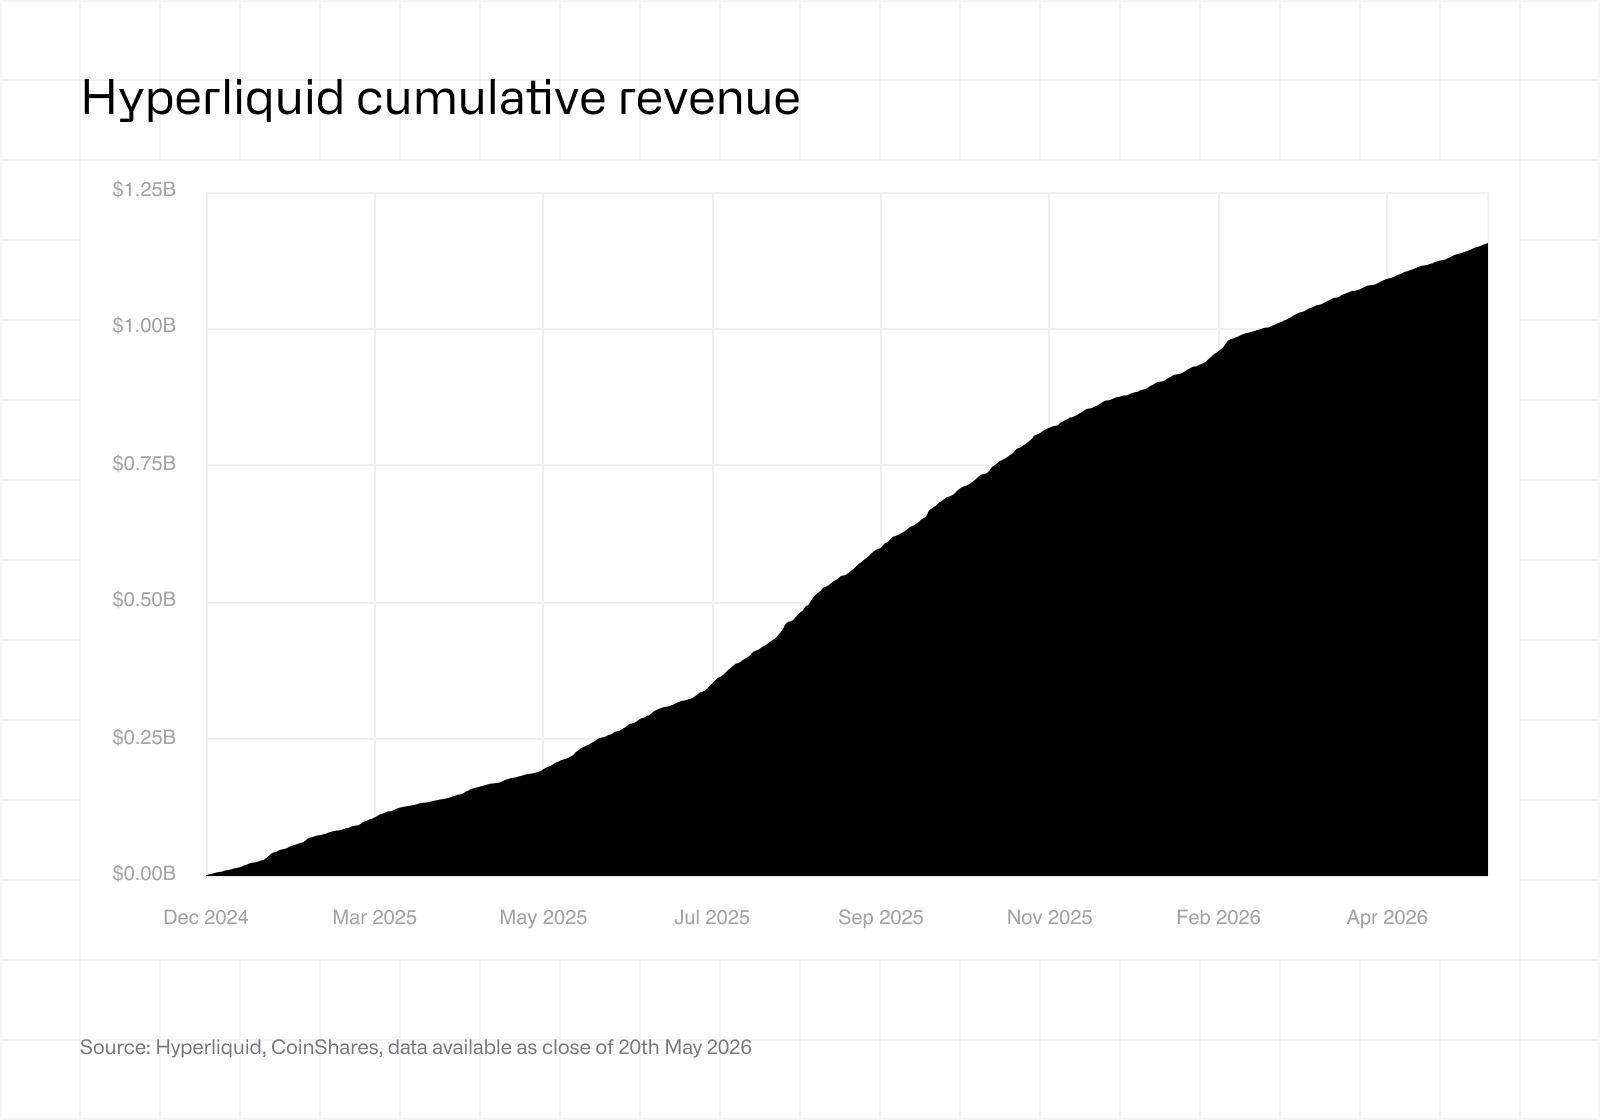
Oltre 1,1 miliardi di dollari di ricavi cumulativi
3. Tokenomics e l’effetto volano del valore
Nel mondo delle criptovalute capita spesso che un protocollo si riveli un prodotto eccezionale, in grado di offrire una reale utilità ai propri utenti o addirittura generare ingenti ricavi. Tuttavia, nella maggior parte dei casi, il legame tra l’economia sottostante dell’applicazione o del protocollo e il token che lo rappresenta rimane particolarmente labile.
Con Hyperliquid è stato introdotto un approccio innovativo ai ricavi. Attraverso il meccanismo dell’Assistance Fund (AF), circa il 99% delle commissioni generate dalla piattaforma viene utilizzato per riacquistare HYPE sul mercato. Come menzionato in precedenza, ciò corrisponde ad oggi a circa 44,4 milioni di token, con un valore attuale superiore a 2 miliardi di dollari.
Diversamente da un meccanismo di burn diretto (come avviene su Ethereum), l’Assistance Fund piazza ordini limite inferiori al prezzo di mercato attuale. Così facendo utilizza USDC per sostenere il rialzo del prezzo del token, quindi invia l’HYPE acquistato a un indirizzo nullo inaccessibile (in occasione di una votazione tenutasi nel dicembre 2025, l’85% dei validatori ha ufficialmente considerato che si trattasse di un burn). Questo meccanismo ha il duplice effetto di ridurre l’offerta in circolazione e, al contempo, di sostenere attivamente il prezzo in caso di ribasso in qualsiasi momento. Il burn EIP-1559 di Ethereum, in confronto, riduce l’offerta ma non genera una domanda equivalente. Hyperliquid fa entrambe le cose. Va precisato che questo confronto si concentra sui meccanismi di accumulo di valore. Sebbene Ethereum presenti altri fattori che ne influenzano la domanda, il punto fondamentale è che i suoi burn non prevedono una componente di acquisto, a differenza del meccanismo di Hyperliquid.
Questo è ciò che rende HYPE veramente unico. Nel corso del tempo, il token dovrebbe comportarsi in maniera simile all’attività sottostante, il che significa che può essere valutato come un’azione, cosa che non è possibile per la maggior parte dei cripto-asset. Con la crescita dei ricavi aumentano anche i buyback, esercitando una pressione diretta sull’offerta in circolazione e generando una domanda continua che sostiene il token in modo sostanziale. Si tratta di un meccanismo unico che, a nostro avviso, ha permesso ad HYPE di salire alla ribalta che merita.
Le commissioni di negoziazione non sono l’unico fattore che genera valore per i possessori di token HYPE. Di recente è stato formalizzato il modello Aligned Quote Asset (AQA), che reindirizza verso l’Assistance Fund una parte del rendimento ottenuto (tramite pronti contro termine e titoli di Stato a breve termine) sulle riserve di USDC detenute su Hyperliquid.
Quando gli utenti depositano USDC per negoziare contratti perpetui su Hyperliquid, quegli USDC fungono da garanzia per le posizioni aperte. Con circa 5 miliardi di dollari in USDC attualmente presenti sulla piattaforma, queste riserve generano un rendimento significativo (dal 3,5 al 4% ai tassi attuali), il 90% del quale viene versato all’Assistance Fund, dove viene convertito in buyback di HYPE secondo il meccanismo descritto in precedenza.
USDH, una stablecoin emessa da Native Markets, è stata la prima a implementare AQA al momento del lancio del modello a settembre 2025, ma non ha mai riscosso un successo significativo. A maggio 2026 l’offerta di USDH si stabilizzava intorno ai 100 milioni di dollari, mentre quella di USDC su Hyperliquid superava i 5 miliardi di dollari. Da allora, Coinbase ha assunto il ruolo di deployer ufficiale della tesoreria AQA per l’USDC, mentre l’USDH viene progressivamente abbandonata.
Ai tassi attuali, il livello AQA contribuisce al buyback con circa 140-160 milioni di dollari all’anno. Questa voce di ricavo dipende dai tassi di interesse e dall’offerta di USDC in circolazione su Hyperliquid, due variabili che analizzeremo in dettaglio più avanti.
L’ultimo meccanismo che influisce sull’offerta sono i livelli di staking. Gli utenti che mettono in staking HYPE sulla piattaforma possono ottenere sconti sulle commissioni in base all’importo messo in staking, che vanno dal 5% per il livello più basso fino al 40% per il livello più alto.
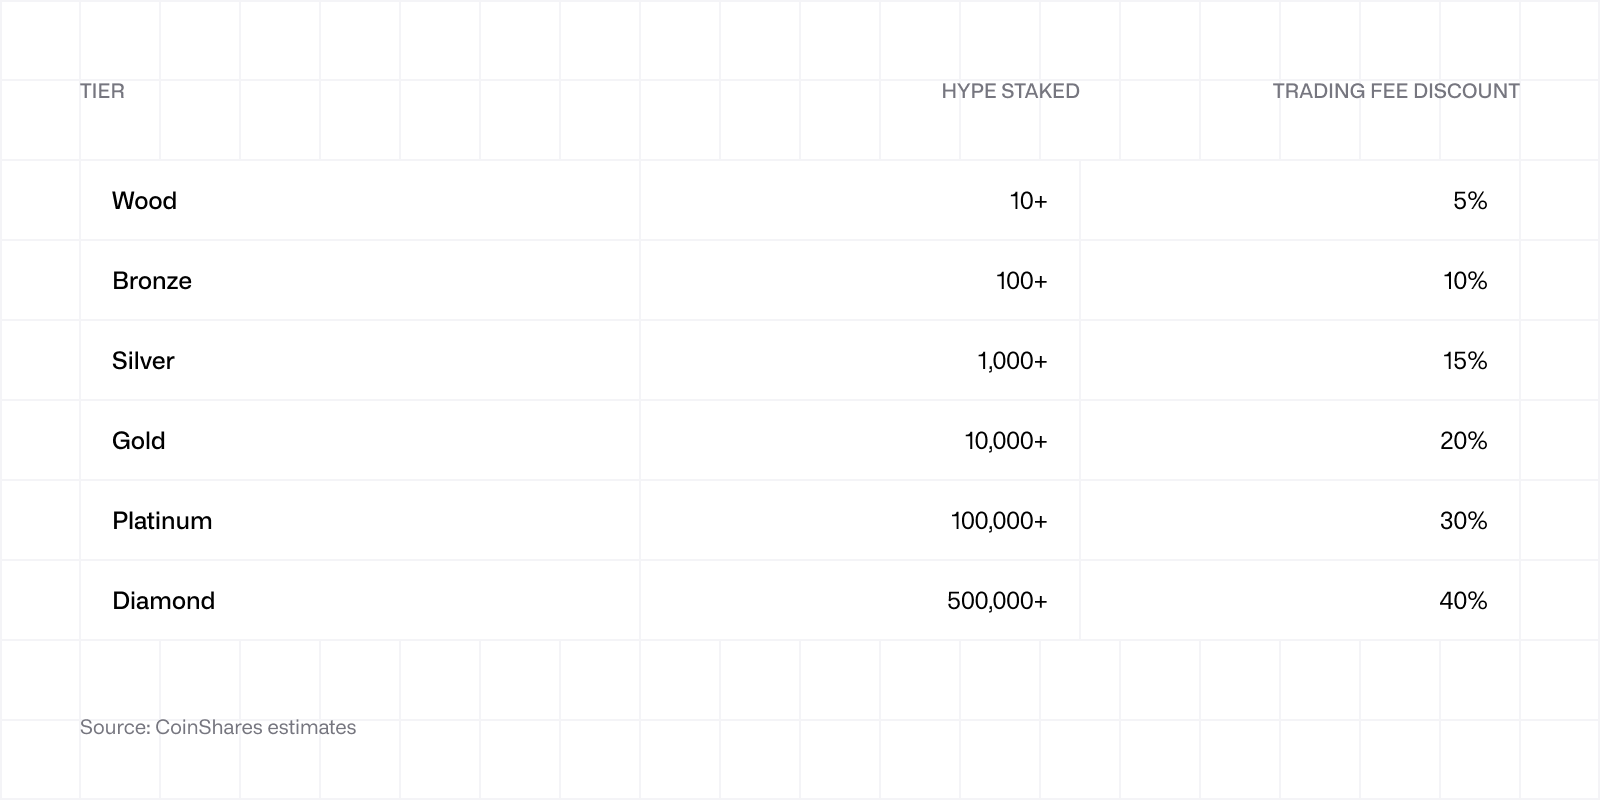 Questo meccanismo crea un allineamento naturale. I trader che generano più commissioni sulla piattaforma sono anche quelli che hanno più interesse a mettere in staking una quantità maggiore di HYPE, il che riduce il flottante scambiabile. Oltre allo sconto sulle commissioni, gli staker guadagnano anche un APY di circa il 2,1% in ricompense HYPE. A differenza del burn effettuato dall’AF, gli HYPE in staking possono essere recuperati (al termine di un periodo di 7 giorni), il che significa che, tecnicamente, questo processo non rimuove i token dall’offerta in circolazione. Tuttavia, la riduzione del flottante scambiabile aumenta la sensibilità del prezzo a qualsiasi acquisto aggiuntivo.
Tenendo conto dell’altro aspetto dell’offerta, la struttura della tokenomics è la seguente:
Offerta totale: 1.000.000.000 HYPE (1 miliardo, fissa)
Emissioni future e ricompense della comunità: 388,88 milioni (38,8%)
Riservate a futuri incentivi per la comunità
Airdrop iniziale di genesi: 310 milioni di token (31%)
Totalmente sbloccati
Collaboratori principali attuali e futuri: 238 milioni di token (23,8%)
Allocazione al team, blocco di 1 anno dopo il lancio del token (TGE), seguito da un rilascio graduale nel periodo 2027-2028 e, in parte, oltre
Budget dell’Hyper Foundation: 60 milioni di token (6%)
Totalmente sbloccati
Sovvenzioni alla comunità: 3 milioni di token (0,3%)
Totalmente sbloccati
HIP-2 (un’allocazione marginale legata al meccanismo AMM spot HIP-2): 120.000 token (0,012%)
Totalmente sbloccati
Un altro aspetto insolito nel mondo delle criptovalute è la mancanza assoluta di allocazioni a venture capital, investitori privati, exchange centralizzati o market maker. Questo aspetto è significativo, non solo dal punto di vista narrativo, ma anche perché significa che il lancio del token è stato equo, premiando i primi utenti della piattaforma e favorendo una determinazione naturale del prezzo. Ciò è rilevante anche dal punto di vista analitico. In assenza di venture capital, investitori privati e costi di quotazione, l’unica offerta proveniente dagli insider che potrebbe essere lanciata sul mercato è l’allocazione riservata al team discussa a seguire.
L’allocazione al team, che ha cominciato a essere rilasciata un anno dopo il TGE, rappresenta la fonte più evidente di eccesso di offerta. In teoria, ci si aspettava l’entrata in circolazione di circa 9,9 milioni di HYPE al mese attraverso un processo di rilascio graduale nel corso di 24 mesi. In realtà, le distribuzioni effettive ai membri del team si sono rivelate nettamente inferiori a quanto previsto:
Dicembre 2025: 1,75 mln di HYPE
Gennaio 2026: 1,2 mln di HYPE
Febbraio 2026: 140.000 HYPE
Marzo 2026: 173.000 HYPE
Aprile 2026: 333.000 HYPE
Sebbene il contratto di maturazione stia rilasciando gli importi previsti, il team ha sistematicamente scelto di rimettere in staking, conservare o comunque non distribuire la maggior parte dei fondi tecnicamente disponibili. Il cofondatore Iliensinc ha confermato a fine dicembre che il team aveva ufficializzato una cadenza fissata al “6 di ogni mese, qualora prevista”, con l’avvertenza implicita che il volume di ciascuna distribuzione rimane discrezionale e non automatico.
In combinazione con il meccanismo di burn dal lato della domanda, ciò ha permesso ad HYPE di rimanere sistematicamente un asset deflazionistico netto dalla scadenza del periodo di blocco. Con l’avvicinarsi di questa scadenza per il team, il mercato aveva inizialmente previsto un notevole eccesso di offerta. Tuttavia, i dati disponibili ad oggi indicano che tale eccesso si è rivelato notevolmente inferiore alle previsioni.
Questo, però, non elimina i rischi futuri. Infatti, la quota dell’allocazione del team ancora bloccata rappresenta tuttora una parte significativa dell’offerta totale, e i comportamenti possono cambiare. Tuttavia, i primi segnali indicano che gli incentivi privilegiano la creazione di valore a lungo termine rispetto alla distribuzione a breve termine.
Nell’ambito della nostra analisi quinquennale, partiamo dal presupposto che il programma contrattuale di maturazione si svolga integralmente, con un’offerta finale in circolazione pari a 707 milioni di HYPE negli scenari bear, base e bull. Questo presupposto si basa su due scelte. In primo luogo, non viene attribuito merito al modello per il fatto che il team continui a distribuire una quantità inferiore a quella prevista dalla tabella di marcia. L’attuale andamento è incoraggiante, ma non offre alcuna garanzia. Prevedere un proseguimento della moderazione significherebbe dare per scontato un comportamento che non è ancora stato messo alla prova nell’arco di un intero ciclo di mercato. In secondo luogo, non riduciamo l’offerta di HYPE in circolazione sulla base del buyback. Come illustrato nella sezione 6, l’effetto del buyback è già incorporato nel multiplo stesso: ridurre ulteriormente l’offerta comporterebbe quindi un doppio conteggio dello stesso meccanismo di accumulo di valore. Questa sembra la scelta giusta. Semmai, è conservativa: se l’offerta finale dovesse scendere sotto i 707 milioni, i nostri prezzi impliciti sarebbero più alti a parità di capitalizzazione di mercato. Ciò significa che i nostri scenari probabilmente sottostimano il potenziale di rialzo invece di sovrastimarlo.
Una volta chiarito in che modo il token acquisisce valore e come si comporta l’offerta, concentriamoci sulle dimensioni del mercato in cui opera Hyperliquid.
4. Dimensioni del mercato e panorama competitivo
Hyperliquid opera principalmente nel mercato altamente competitivo dei contratti perpetui. Secondo l’Annual Crypto Report 2025 di CoinGecko, il volume di negoziazione dei contratti perpetui ha raggiunto l’incredibile cifra di 92.900 miliardi di dollari. Di questo totale, i volumi sugli exchange decentralizzati hanno raggiunto il livello record di 6.700 miliardi di dollari (con un aumento del 346% su base annua), a dimostrazione del fatto che la categoria dei contratti perpetui on-chain si trova nella fase più intensa della sua curva di crescita. Sebbene ci sia un segmento di utenti disposto a investire solo in un tipo di piattaforma, la maggior parte è in grado di scegliere tra le due. Pertanto possiamo affermare che la concorrenza di Hyperliquid non si limita alle piattaforme decentralizzate (dYdX, Drift, Jupiter, Aster, Phoenix, ecc.), ma comprende anche giganti centralizzati come Binance, Bybit e OKX.
Se da un lato è importante fare una proiezione della crescita delle dimensioni complessive del mercato, come avviene nel nostro modello, dall’altro è altrettanto essenziale calcolare la quota di mercato storicamente detenuta da Hyperliquid e la sua evoluzione futura.
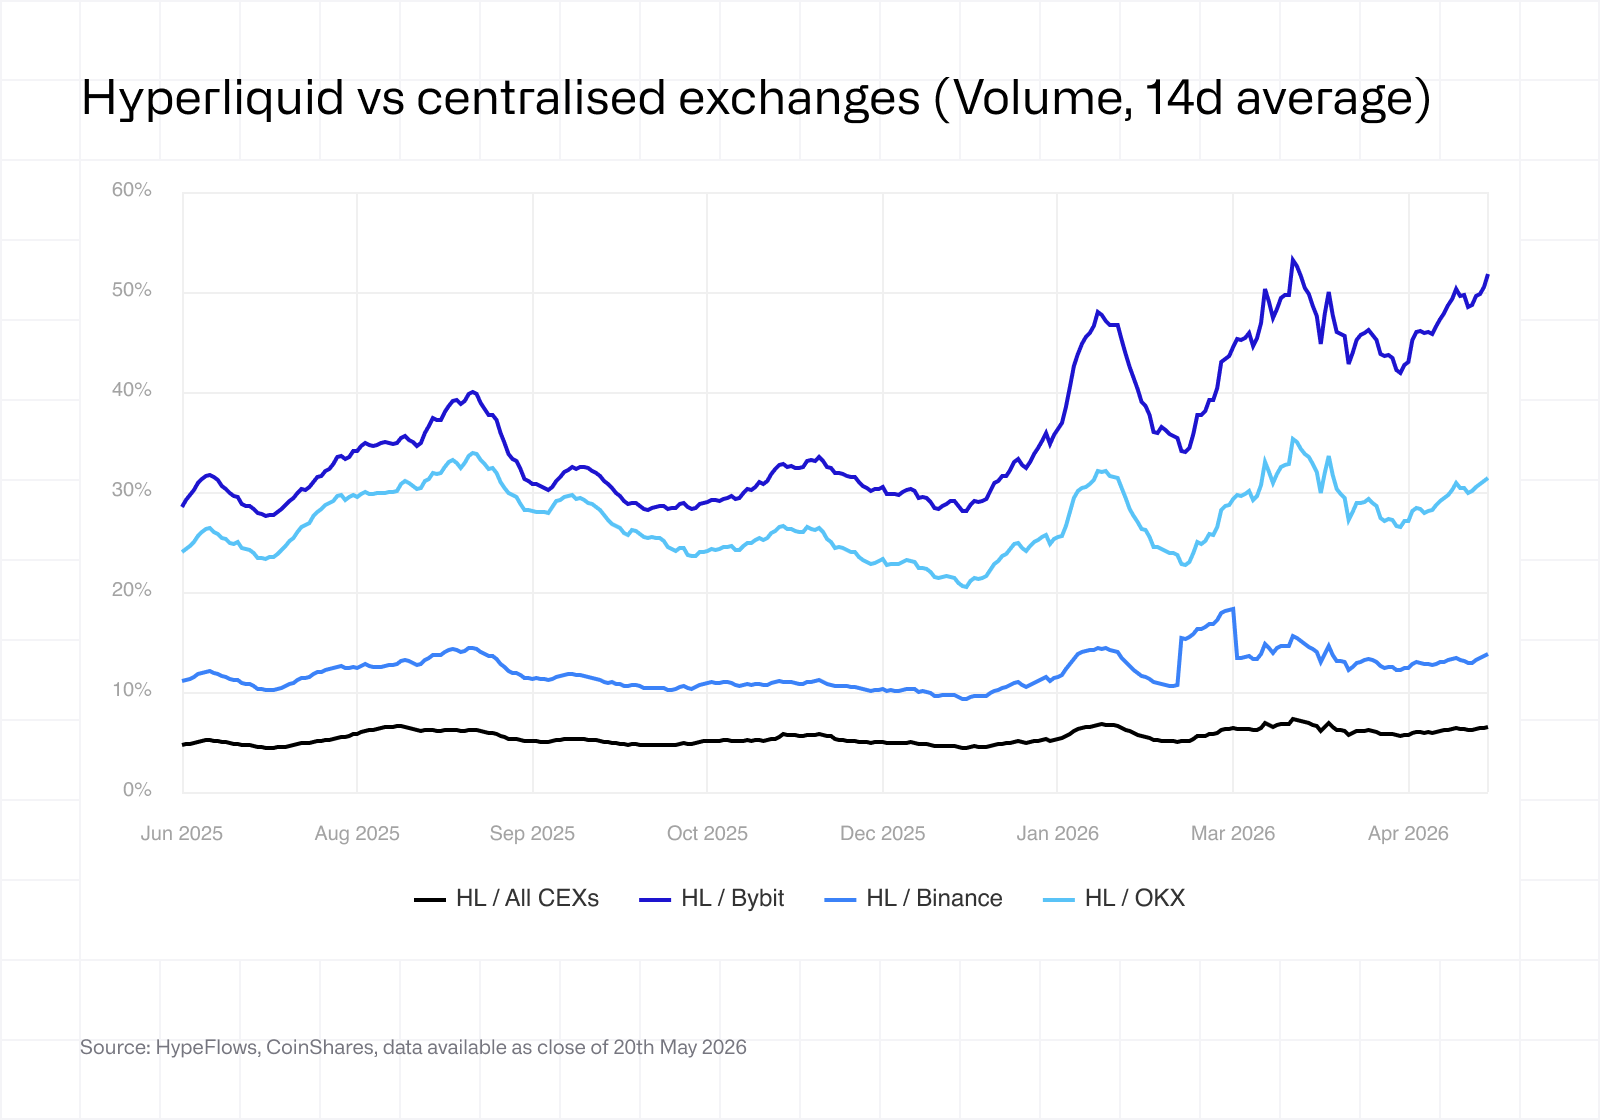
 Un anno fa, Hyperliquid rappresentava circa il 5% del volume complessivo di scambi di tutti gli exchange centralizzati messi insieme. La cifra è ora salita al 6-7%. Sebbene questo valore rimanga modesto in termini assoluti, è importante ricordare che il progetto è partito da zero nel 2023 (i dati non vanno abbastanza indietro nel tempo da poterlo illustrare). Hyperliquid sta progressivamente conquistando quote di mercato in un settore dominato da piattaforme attive da quasi un decennio e che dispongono di risorse notevolmente superiori.
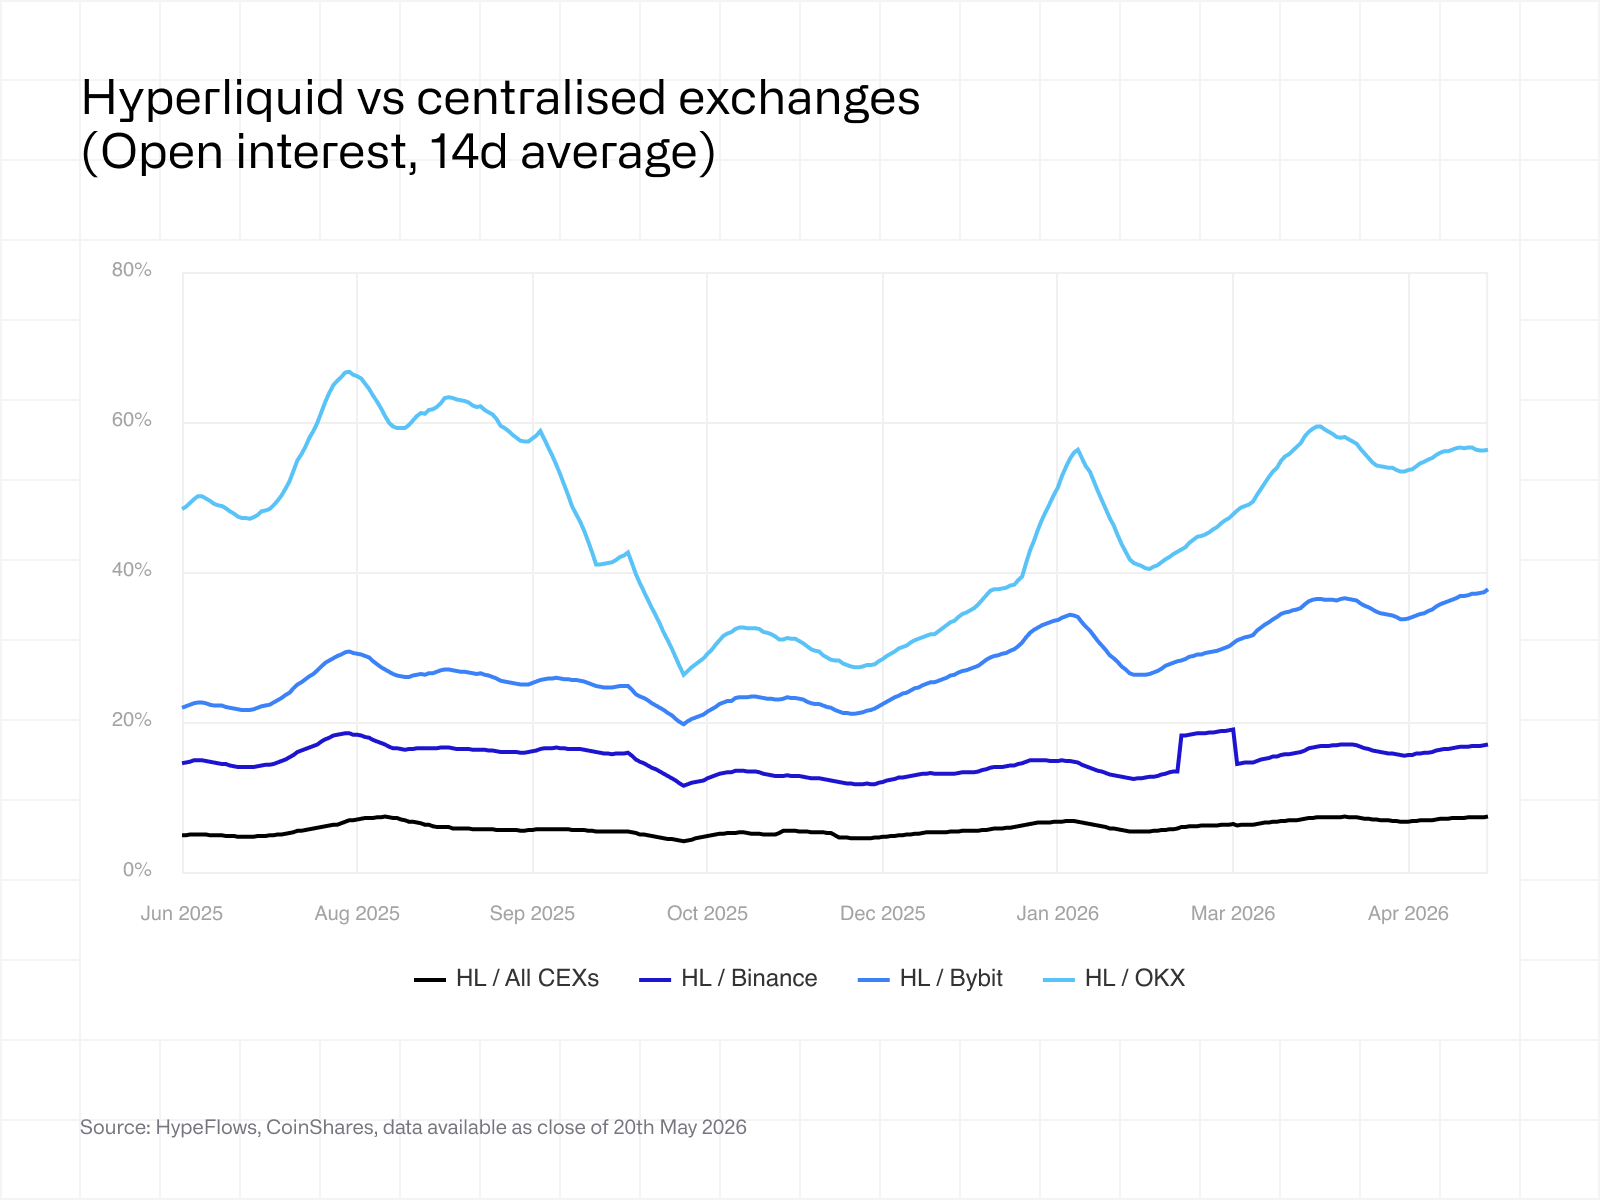
Questo risulta ancora più evidente se si analizzano i dati per ciascun CEX. Rispetto a Bybit, Hyperliquid è passata da circa il 30% a oltre il 50% di volume di negoziazione nel corso di dodici mesi. Rispetto a OKX, il rapporto è passato da circa il 25% a circa il 31% in termini di volume e da circa il 45% a circa il 57% per quanto riguarda l’open interest. Binance rimane la più resiliente tra le tre, ma anche in questo caso Hyperliquid ha guadagnato un po’ di terreno.
È importante sottolineare anche il contesto in cui ciò è avvenuto: i mercati delle criptovalute sono stati piuttosto piatti per gran parte di questo periodo.
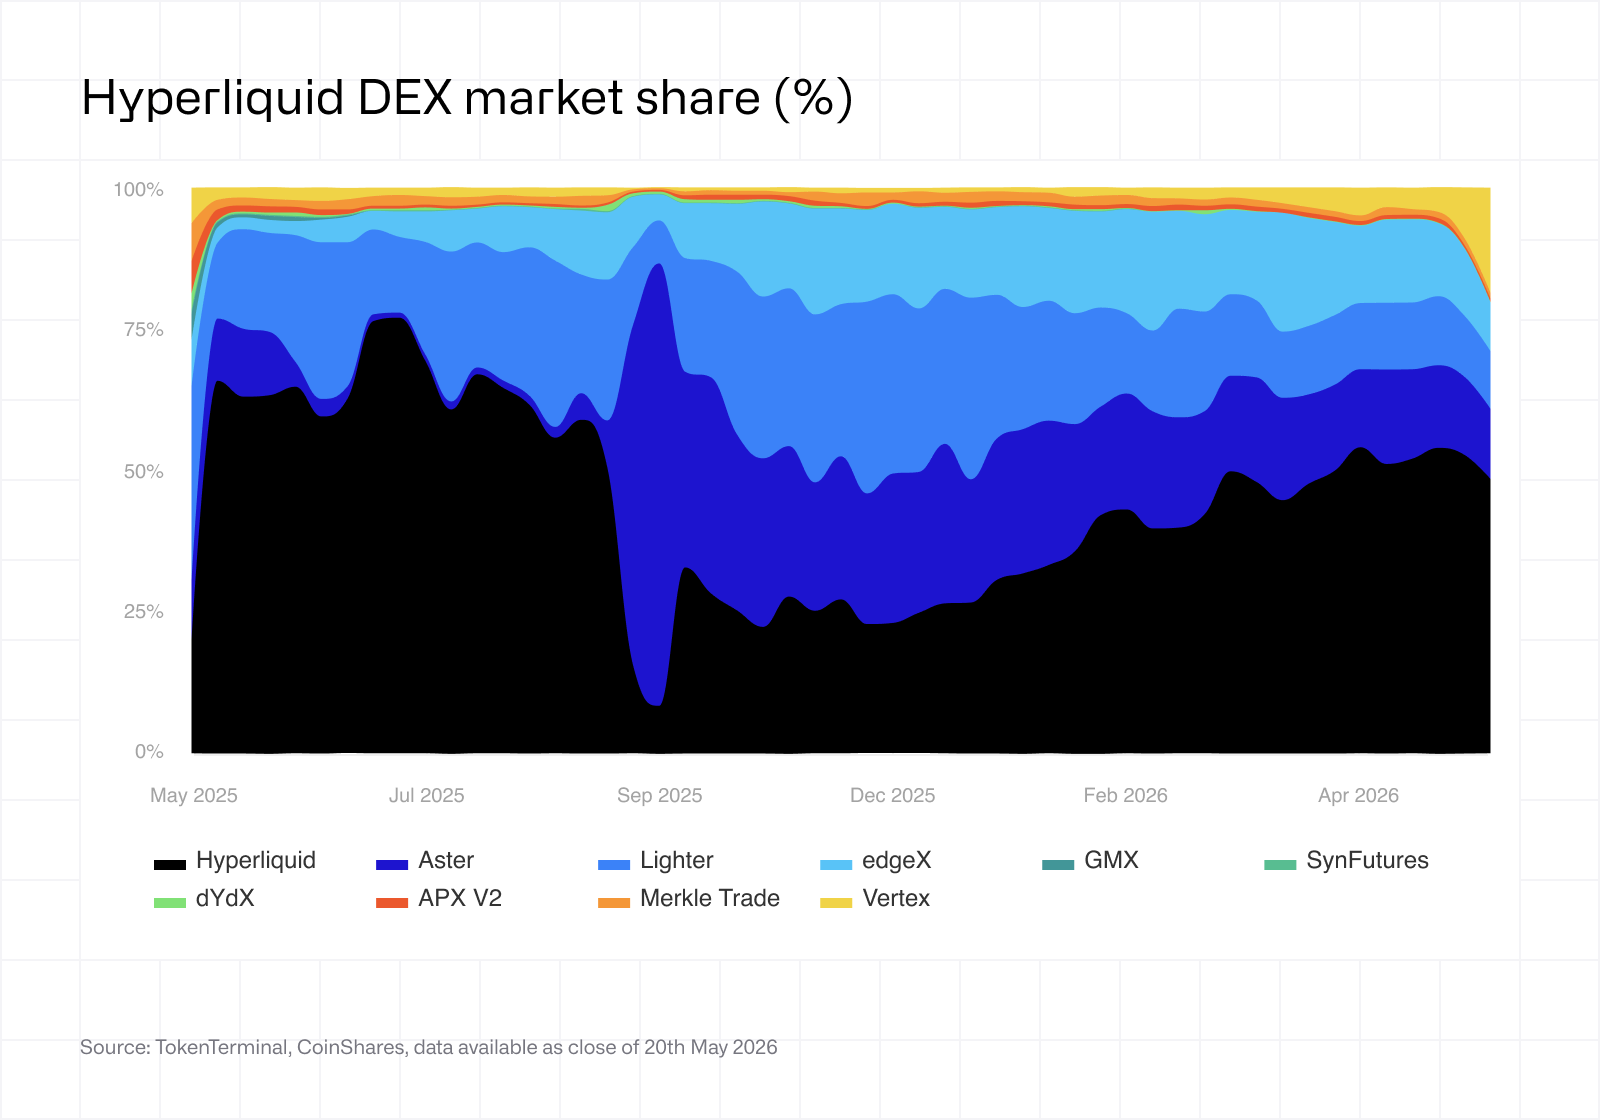 Il grafico di cui sopra mostra la quota di mercato di Hyperliquid rispetto ai DEX di contratti perpetui nello scorso anno. È importante fare subito alcune puntualizzazioni: l’insieme di dati non include tutti i concorrenti (tra i quali mancano Drift, Jupiter e Phoenix), pertanto la quota di Hyperliquid risulta leggermente sovrastimata. Secondo le nostre stime interne, la quota di mercato effettiva tra i DEX di contratti perpetui si attesta più vicino alla fascia del 30-40%.
Il grafico solleva comunque un aspetto che merita di essere approfondito. La striscia nera rappresenta Aster, che ha brevemente conquistato una quota importante tra agosto e settembre 2025, prima di crollare nuovamente. Come già menzionato, si riteneva che gran parte del volume di Aster in quel periodo fosse dovuto al wash trading e all’incentive farming, anziché a una domanda reale. Il grafico illustra chiaramente quanto questo tipo di attività possa distorcere le misurazioni delle quote di mercato e ci ricorda che non tutti i volumi dichiarati hanno lo stesso valore.
In conclusione, il segmento dei DEX di contratti perpetui è competitivo e dinamico. Hyperliquid è il leader indiscusso, ma la concorrenza è reale e in continua evoluzione. Ai fini della valutazione, la questione non è se ci sia concorrenza, ma quale quota di mercato Hyperliquid sia in grado di difendere in un orizzonte temporale di cinque anni. Approfondiremo questo argomento nelle nostre ipotesi di scenario più avanti nel report.
Il segmento stesso dei contratti perpetui è in evoluzione. Per la maggior parte della storia delle criptovalute, i contratti perpetui sono stati sostanzialmente sinonimo di esposizione alle criptovalute (ad esempio, posizioni lunghe su BTC e posizioni corte su ETH). HIP-3 ha aperto la strada ai contratti perpetui su asset reali tokenizzati, quali materie prime, indici azionari, valute e azioni pre IPO. Questi sono mercati le cui controparti tradizionali scambiano migliaia di miliardi di dollari all’anno. Si tratta di un mercato indirizzabile fondamentalmente diverso. Pertanto, Hyperliquid non ha bisogno di conquistarne una quota significativa per aumentare in modo sensibile i propri ricavi. Nello scenario bull, i contratti perpetui on-chain diventeranno il canale naturale per accedere a questi mercati 24 ore su 24 e 7 giorni su 7, su scala globale e senza i vincoli inerenti alle piattaforme di intermediazione tradizionali. Nello scenario bear, le piattaforme regolamentate manterranno il flusso istituzionale e la negoziazione on-chain rimarrà di nicchia. Entrambi gli scenari sono rappresentati nel modello.
Una logica simile si applica, su scala minore, ai mercati predittivi attraverso HIP-4. Questo è un segmento ancora nuovo su Hyperliquid (attivo da maggio 2026) e nell’intero panorama on-chain, ma il mercato sottostante esiste e cresce rapidamente. Polymarket ha registrato un volume di negoziazione superiore a 26 miliardi di dollari nel solo primo trimestre del 2026[1], con un aumento del 90% rispetto al trimestre precedente, e marzo 2026 è stato il primo mese a superare la soglia dei 10 miliardi di dollari in un singolo mese. Difficilmente Hyperliquid riuscirà a prendere il posto di Polymarket nel breve termine, ma non è nemmeno necessario che lo faccia: nel nostro modello i mercati predittivi rappresentano una forma di opzionalità, e non un pilastro della nostra analisi.
In sintesi, Hyperliquid è riuscita a conquistare una quota significativa nel proprio mercato principale, nonostante la concorrenza ben consolidata e un contesto macroeconomico particolarmente difficile. Diversi mercati correlati, come gli asset reali tokenizzati e i mercati predittivi, ampliano notevolmente il suo mercato potenziale. Hyperliquid sta tentando di diventare “la blockchain che ospita l’intero settore finanziario” e farà il possibile per sottrarre quote di mercato ai grandi nomi.
5. Flussi di ricavi
5a. Contratti perpetui
Attualmente Hyperliquid registra un volume annualizzato di circa 2.450 miliardi di dollari (circa 938 miliardi di dollari YTD). La struttura delle commissioni dipende naturalmente, come già illustrato, dal fatto che l’utente metta o meno in staking il token sottostante per ottenere sconti. A determinati volumi, i market maker possono ottenere rimborsi dal protocollo in cambio dell’apporto di liquidity e della riduzione degli spread.
L’attuale tasso di commissione del protocollo ammonta a circa 3,14 punti base al netto dei rimborsi, dei builder code e di altre allocazioni. A parità di condizioni, ciò significa che il protocollo è destinato a guadagnare circa 770 milioni di dollari nel 2026. È importante sottolineare che le commissioni lorde pagate dagli utenti si aggirano intorno ai 7 punti base. La differenza, pari a circa il doppio, è dovuta ai rimborsi, al routing dei builder code (un modello di ripartizione delle commissioni che incentiva i front-end terzi a indirizzare i flussi verso Hyperliquid), nonché l’allocazione all’HLP (il vault interno del protocollo dedicato al market making, che riceve una parte delle commissioni come compenso per la fornitura di liquidity).
La domanda, a questo punto, è quanto volume sia in grado di conquistare Hyperliquid nei prossimi cinque anni. Il nostro modello affronta la questione da tre punti di vista: le dimensioni totali che raggiungerà il mercato dei contratti perpetui, la quota di tale volume che passerà on-chain e, infine, la quota di tale volume on-chain che sarà detenuta da Hyperliquid.
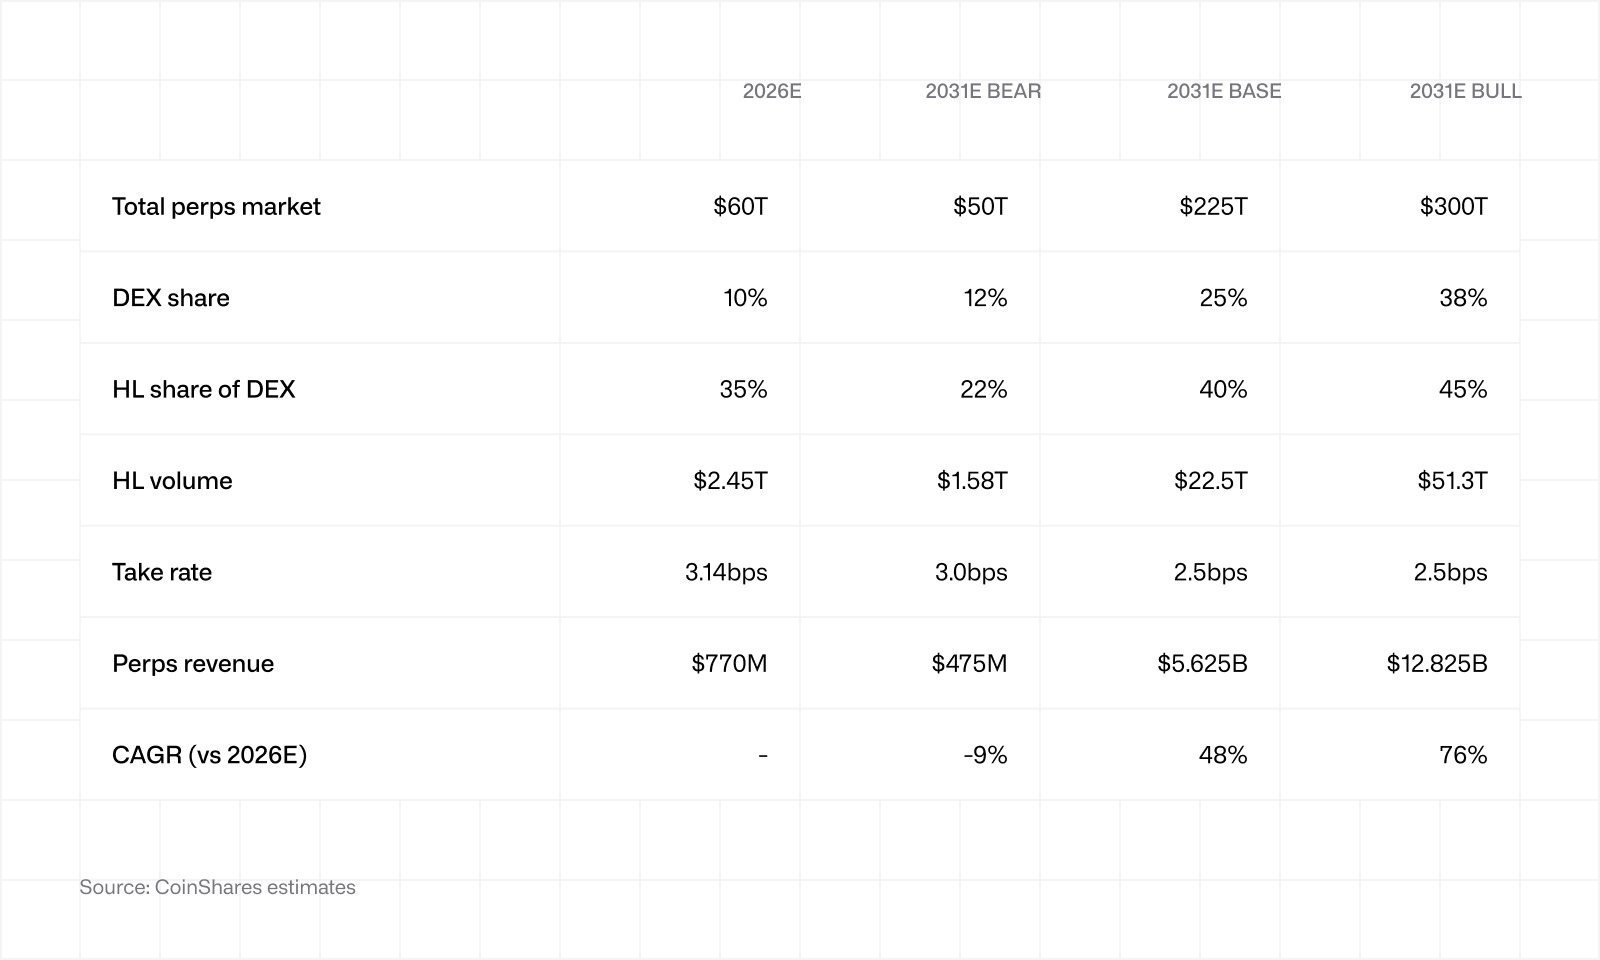 Si noti che, nello scenario bear, il tasso di commissione è leggermente più alto rispetto agli scenari base e bull. In un contesto caratterizzato da volumi ridotti, infatti, un numero minore di market maker raggiunge i livelli di rimborso più elevati e il protocollo è sottoposto a una minore pressione concorrenziale a concedere sconti. Di conseguenza, il protocollo trattiene una quota maggiore delle commissioni lorde. Al contrario, negli scenari base e bull succede l’opposto: ipotizziamo una contrazione del tasso di commissione a circa 2,5 punti base man mano che i flussi istituzionali e quelli convogliati dai builder aumentano in proporzione al volume totale.
Lo scenario bear non si basa sul fallimento di Hyperliquid, ma ipotizza una situazione in cui il mercato complessivo dei contratti perpetui non cresca molto rispetto ai livelli attuali, la quota dei DEX cresca moderatamente fino al 12% e Hyperliquid perda una quota importante a favore della concorrenza (dal 35% al 22%). Anche in queste circostanze, la piattaforma registra comunque un volume di 1.580 miliardi di dollari all’anno. I ricavi scendono da 770 a circa 475 milioni di dollari, il che rappresenta un drawdown significativo, ma la piattaforma è tutt’altro che irrilevante. Si noti che lo scenario bear non si applica ai possibili rischi che potrebbero causare il fallimento totale di Hyperliquid; questi saranno discussi separatamente. Nello scenario bear la piattaforma continua a operare normalmente, senza però ottenere il successo sperato.
Lo scenario base assume una visione più costruttiva dell’adozione delle criptovalute. Il mercato complessivo dei contratti perpetui cresce di quasi quattro volte, raggiungendo i 225.000 miliardi di dollari (in base ai CAGR a 3 e 5 anni), man mano che il settore delle criptovalute matura, la quota dei DEX sale al 25% e Hyperliquid ne detiene il 40%. Abbiamo già affrontato il tema dell’andamento delle quote di mercato nella sezione 4 e abbiamo previsto un tasso di crescita moderatamente prudente. Il risultato sono un volume annuale di 22.500 miliardi di dollari e 5,6 miliardi di dollari di ricavi, un CAGR del 48%.
Lo scenario bull ipotizza che i contratti perpetui on-chain si diffondano su larga scala. Il mercato complessivo dei contratti perpetui raggiunge i 300.000 miliardi di dollari, la quota dei DEX raggiunge il 38% e Hyperliquid rafforza il proprio vantaggio competitivo, raggiungendo il 45% del volume dei DEX. Questo si traduce in un volume annuale di 51.000 miliardi di dollari e 12,8 miliardi di dollari di ricavi, un CAGR del 76%. Sebbene risulti ottimistica, questa stima non è infondata, considerando che i volumi dei contratti perpetui hanno registrato un CAGR ben superiore al 100% in alcuni degli ultimi anni. È importante sottolineare che questa sezione non considera i contratti perpetui HIP-3, ovvero azioni, indici, coppie di valute e materie prime negoziabili.
I contratti perpetui rappresentano oggi oltre il 75% dei ricavi di Hyperliquid. Sebbene singolarmente più modeste, le altre fonti di ricavo potrebbero diventare, nel lungo periodo, fattori significativi.
5b. Spot
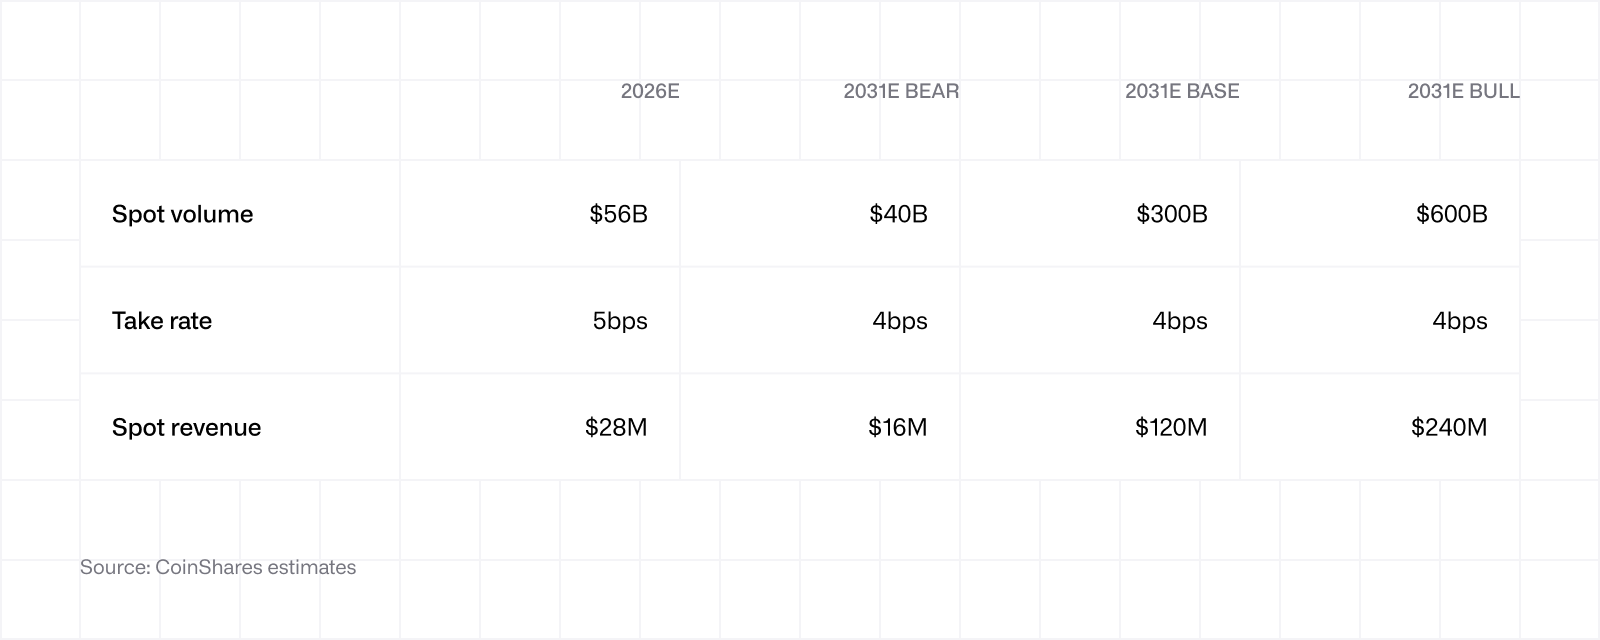
Il trading spot su Hyperliquid registra attualmente un volume annualizzato di circa 56 miliardi di dollari, generando ricavi per 28 milioni di dollari. Sebbene, in termini assoluti, sia ridotto rispetto ai contratti perpetui, vale la pena prenderlo in considerazione per due motivi. Primo, il tasso di commissione spot nel mercato è più alto rispetto a quello dei contratti perpetui (circa 5 punti base vs 3,14 punti base), il che significa che ogni dollaro di volume dei contratti spot contribuisce maggiormente al buyback rispetto a ogni dollaro di volume dei contratti perpetui. Secondo, l’asta di ticker HIP-1 (un’asta olandese in cui i progetti offrono HYPE per ottenere il diritto di quotare un nuovo token sul mercato spot di Hyperliquid) generano un flusso naturale di nuove quotazioni, garantendo così un volume ricorrente sulla piattaforma (come spiegato nella sezione seguente).
 I fattori trainanti sono simili a quelli dei contratti perpetui, ma con un’ulteriore dinamica: le coppie di trading spot HYPE-USDC non passano attraverso il meccanismo di riacquisto dell’AF. La porzione di HYPE viene bruciata direttamente.
Si prega inoltre di notare che il modello prevede una riduzione del tasso di commissione nel corso del tempo, poiché le commissioni sono probabilmente destinate a diventare più competitive nei mercati spot in generale.
5c. Commissioni per le aste HIP-1
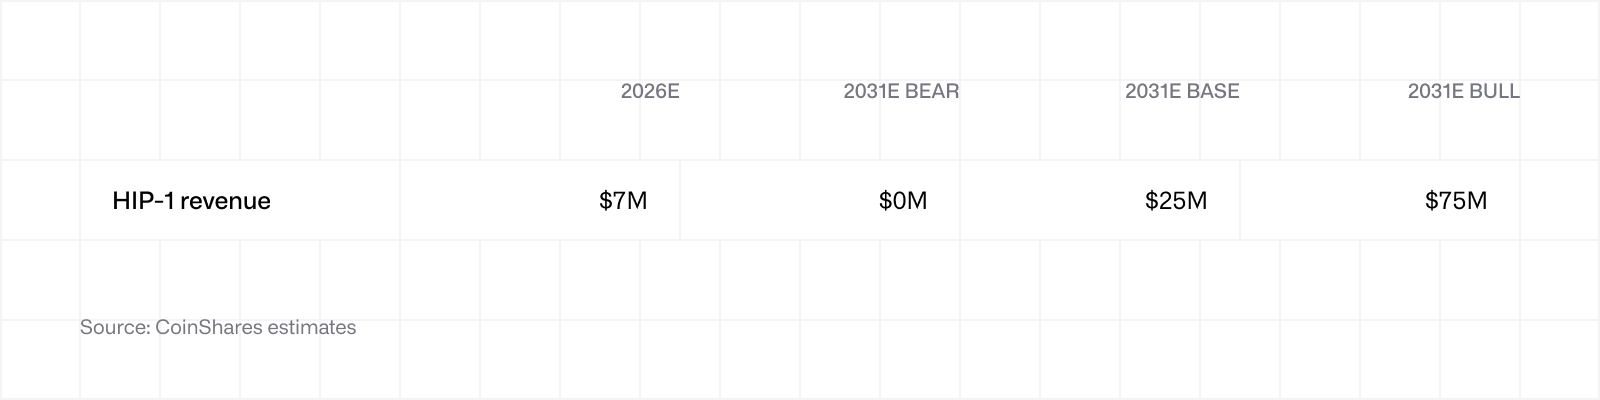
Le aste di ticker HIP-1 generano attualmente un flusso di ricavi modesto per Hyperliquid, ma in futuro potrebbero contribuire in modo significativo ai risultati netti. Ogni asta viene pagata in HYPE al prezzo dell’offerta vincente e l’intero ricavato viene devoluto all’AF per il buyback. Il sistema HIP-1 sta attualmente generando un ricavo annualizzato di circa 7 milioni di dollari (circa 500 HYPE per ticker).
Agli inizi, i ricavi annualizzati hanno raggiunto un picco di circa 75 milioni di dollari, e il nostro scenario bull prevede un ritorno a tali livelli.
 Nel complesso, HIP-1 non rappresenterà una fonte di ricavi significativa, ma è comunque opportuno menzionarlo per completezza.
5d. HIP-3 (contratti perpetui su asset reali tokenizzati)
Lanciato a ottobre 2025, HIP-3 rappresenta il livello dello stack di Hyperliquid che apre davvero la strada a nuovi mercati potenziali. La premessa è semplice: qualunque builder con 500.000 HYPE in staking può lanciare un mercato di contratti perpetui su Hyperliquid per qualunque asset desideri, soggetto ad approvazione da parte dei validatori. Il risultato è un marketplace permissionless per materie prime tokenizzate, indici azionari, coppie di valute, azioni pre IPO e qualsiasi altro asset con un flusso di dati affidabile proveniente da un oracolo.
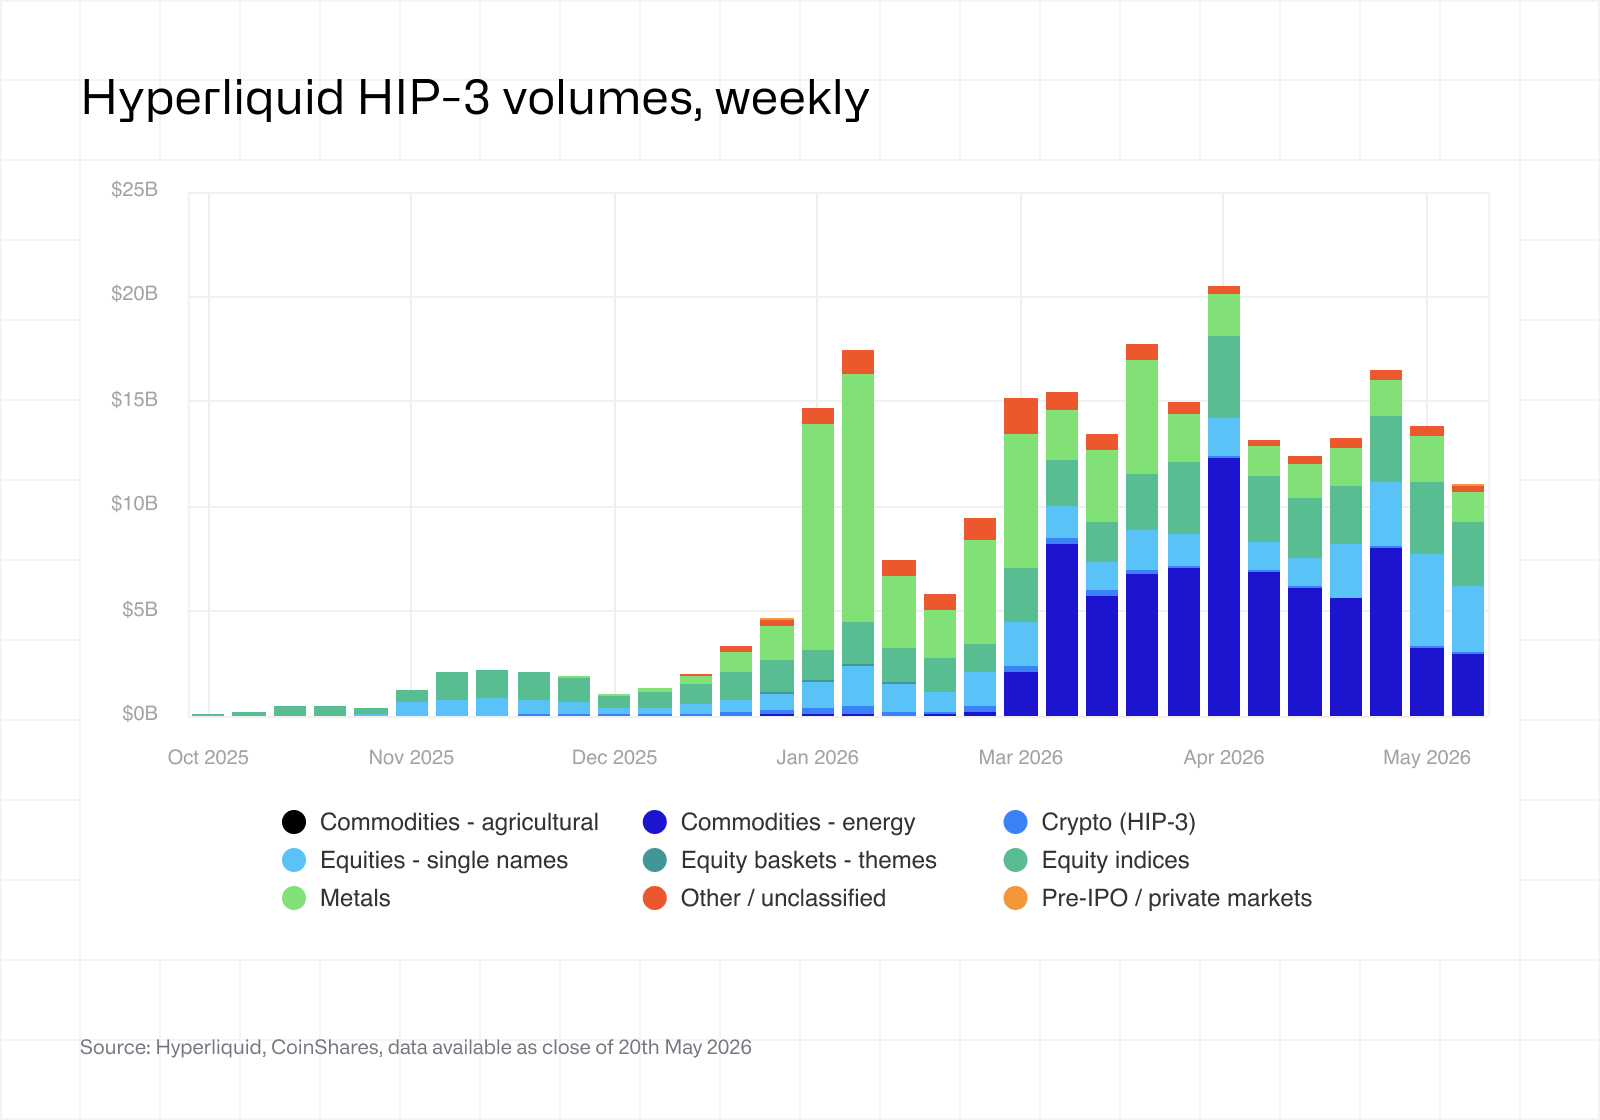
L’adozione è stata rapida, sostenuta da due eventi principali: da un lato, la sovraperformance dei metalli preziosi all’inizio del 2026 ha spinto molti trader ad abbandonare le coppie di criptovalute a favore dei contratti sull’ORO e sull’ARGENTO; dall’altro, l’acuirsi delle tensioni geopolitiche in Iran alla fine di febbraio ha determinato un forte aumento del volume dei contratti sul PETROLIO, in particolare durante i fine settimana, periodi in cui Hyperliquid offriva una delle poche quotazioni liquide mentre i mercati tradizionali delle materie prime erano chiusi.
Dal suo lancio, HIP-3 ha registrato un volume cumulativo superiore a 60 miliardi di dollari e ha attirato più di 75.000 trader unici. trade.xyz, che attualmente rappresenta circa il 90% dell’open interest su HIP-3, ha ottenuto a marzo 2026 una licenza ufficiale da S&P Dow Jones Indices per un contratto perpetuo che segue l’indice S&P 500. È la prima volta che un importante indice della TradFi viene ufficialmente concesso in licenza per un prodotto perpetuo decentralizzato. Questo tipo di riconoscimento istituzionale non si verifica per le infrastrutture di nicchia.
 I mercati HIP-3 applicano commissioni doppie rispetto a quelle di un contratto perpetuo standard, ripartite in parti uguali tra il deployer e il protocollo. Di conseguenza, il protocollo incassa commissioni per transazione sostanzialmente equivalenti a quelle di un contratto perpetuo standard. A complicare il quadro è la “Growth Mode”: un’impostazione opzionale che il deployer può attivare per ridurre le commissioni totali del 90% per 30 giorni, al fine di aumentare rapidamente la liquidity. Attualmente la maggior parte dei mercati HIP-3 è in Growth Mode, il che spiega perché il tasso di commissione effettivo del protocollo si attesta a circa 0,55 punti base, contro i circa 3 punti base previsti dalle condizioni standard.
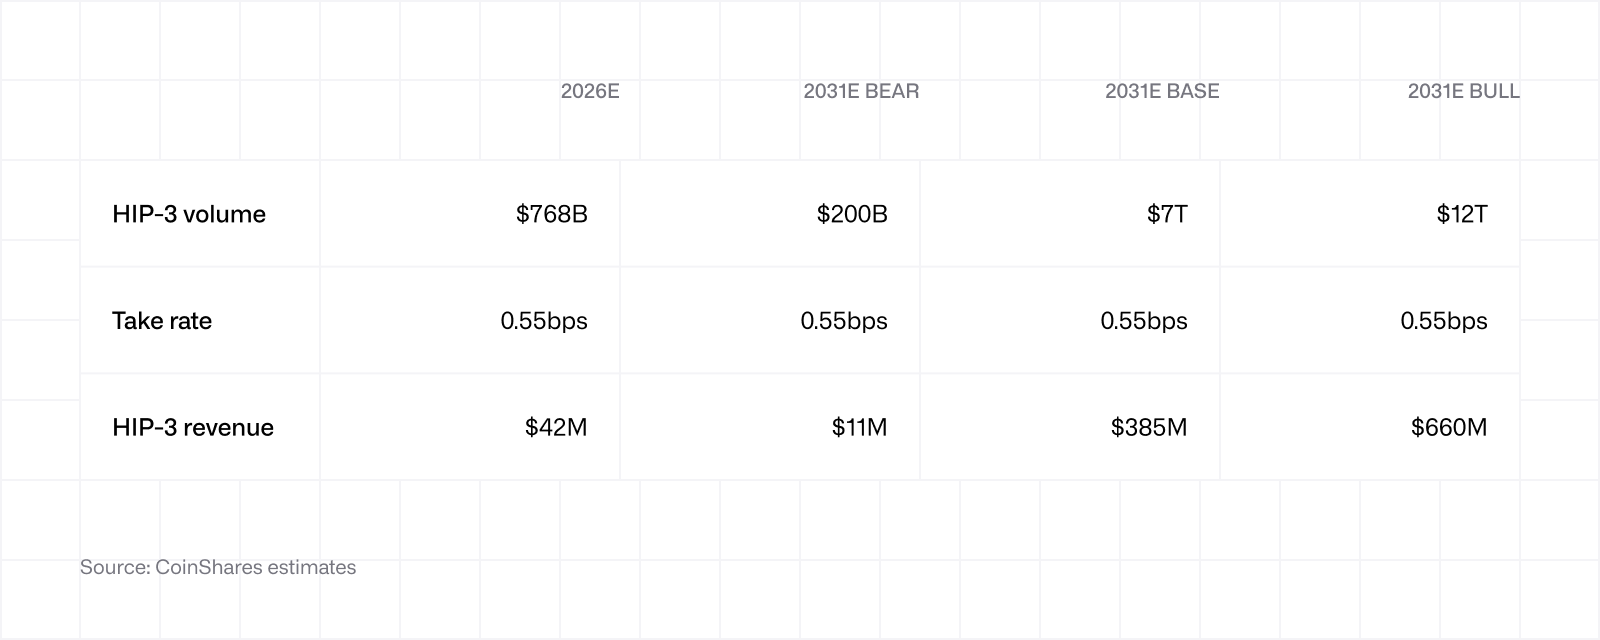 Il tasso di commissione viene mantenuto costante in tutti e tre gli scenari a circa 0,55 punti base. Questo perché la Growth Mode può essere rinnovata all’infinito a discrezione del deployer, e non abbiamo certezze su quando (né tantomeno se) i principali deployer passeranno alle tariffe standard. Consideriamo l’eventuale passaggio a condizioni standard come un potenziale rialzo non incluso nelle proiezioni, anziché come parte dello scenario base.
In termini di volumi, qui lo spread tra bear e bull è più ampio rispetto a qualsiasi altra fonte di ricavi del modello, il che riflette la reale incertezza sulle dimensioni che il mercato HIP-3 finirà per raggiungere. La situazione si sta evolvendo proprio ora in maniera molto rapida. Affermare con certezza che Hyperliquid diventerà la piattaforma dominante per i contratti perpetui su asset reali on-chain sarebbe azzardato. Tuttavia, è certamente possibile, dato che la piattaforma si è già dimostrata un luogo utile per la negoziazione 24 ore su 24, 7 giorni su 7, e l’accesso ad azioni pre IPO (come si è potuto vedere di recente con Cerebras, quando alcuni dirigenti di Wall Street sono stati fotografati con Hyperliquid sullo schermo prima ancora della quotazione in borsa del titolo).
Su tutti e tre gli scenari incombe un rischio concreto: la possibilità che piattaforme regolamentate come il CME o l’ICE lancino i propri mercati tokenizzati, assorbendo così flussi futuri che, altrimenti, sarebbero andati a Hyperliquid o a blockchain concorrenti. C’è anche un aspetto più immediato che vale la pena sottolineare: il CME e l’ICE hanno già esortato le autorità di regolamentazione statunitensi a esaminare Hyperliquid, facendo riferimento a presunti rischi di manipolazione. La fondatezza di tali timori è discutibile. Il motivo alla base degli stessi, invece, è evidente: i grandi nomi hanno un chiaro interesse a frenare la concorrenza on-chain prima che questa abbia il tempo di crescere. Vale la pena sottolineare che Hyperliquid è soggetta a blocco geografico negli Stati Uniti, quindi il punto non è che le autorità di regolamentazione statunitensi possano letteralmente bloccare la piattaforma. Si tratta piuttosto del fatto che lo scenario bull presuppone l’accettazione normativa, un processo che spesso si rivela lungo e tortuoso.
5e. HIP-4 (mercati predittivi)
HIP-4 è stato lanciato il 2 maggio 2026. Al momento della stesura del report, si tratta dell’ultima novità aggiunta allo stack di Hyperliquid, ma anche di quella meno collaudata. Per questo motivo consideriamo il suo contribuito alla stima 2026 come nullo. Questo meccanismo consente la creazione di mercati predittivi interamente on-chain, con contratti binari basati su eventi del mondo reale e regolati in USDC.
Questa categoria esiste ed è in crescita. Polymarket ha registrato un volume di oltre 26 miliardi di dollari nel solo primo trimestre del 2026, e marzo 2026 è stato il primo mese a superare la soglia dei 10 miliardi di dollari. Nel segmento regolamentato, Kalshi ha seguito un andamento simile. Hyperliquid presenta dei vantaggi strutturali: l’assenza di commissioni all’apertura delle posizioni, la collateralizzazione integrale e la possibilità di combinare l’esposizione ai mercati predittivi con posizioni su prodotti derivati all’interno della stessa piattaforma. Se HIP-3 può servire da indicatore del successo che avrà l’implementazione di questo mercato, ci sono buone ragioni per essere almeno moderatamente ottimisti sul suo andamento.
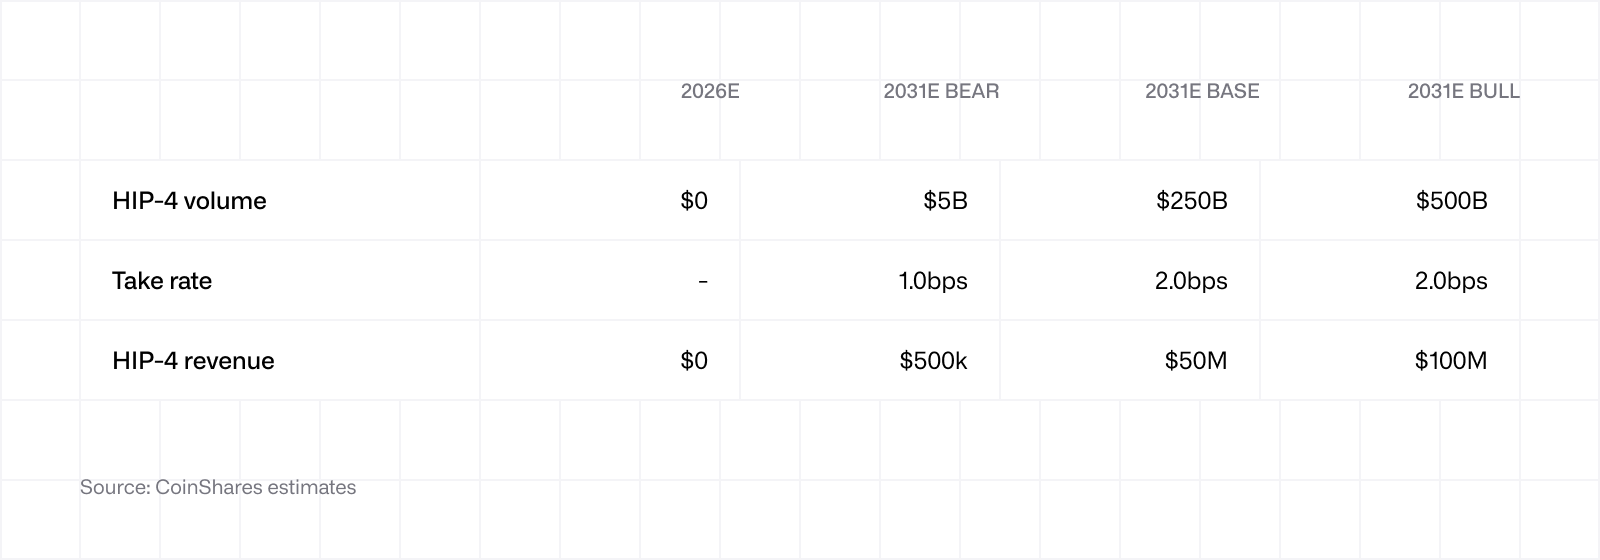 Gli scenari sono volutamente ampi. Nello scenario bear, HIP-4 viene lanciato ma non guadagna terreno. Un volume annualizzato di 5 miliardi di dollari entro il 2031 significherebbe che, in cinque anni di crescita, Hyperliquid conquisterebbe meno del 5% dell’attuale tasso di crescita di Polymarket. Lo scenario base prevede che Hyperliquid raggiunga circa 4 volte il volume attuale di Polymarket entro il 2031 (in questo scenario prevediamo che anche Polymarket cresca). Lo scenario bull prevede invece una crescita di 8 volte. Nessuno di questi scenari renderebbe HIP-4 il principale motore della valutazione, ma nello scenario base aggiungerebbe circa 50 milioni di dollari ai buyback annuali, mentre nello scenario bull circa 100 milioni di dollari.
Questa sezione è probabilmente quella che presenta il margine di errore più elevato nelle previsioni. Infatti, trovandoci in una fase iniziale, i meccanismi sottostanti non sono ancora stati compresi appieno.
5f. HyperEVM
HyperEVM è il livello di smart contract a uso generico descritto in precedenza del report. Oggi il Total Value Locked si attesta a circa 1,5 miliardi di dollari, distribuito tra protocolli di prestito, vault e varie dApp. Il contributo ai ricavi del protocollo deriva dalle gas fee e dall’attività dell’ecosistema, anziché direttamente dalle commissioni di negoziazione.
In tutta onestà non crediamo che HyperEVM sia in grado di sostituire Ethereum o Solana nel settore della DeFi generale. Detto questo, il sistema è cresciuto più rapidamente di molte L1 concorrenti. HyperLend e Morpho detengono insieme circa la metà del TVL totale di HyperEVM, con i prestiti come categoria dominante. Sebbene HyperEVM possa sorprendere al rialzo, le nostre stime indicano che, anche nello scenario bull, il contributo al burn derivante dalle commissioni on-chain rimarrà modesto.
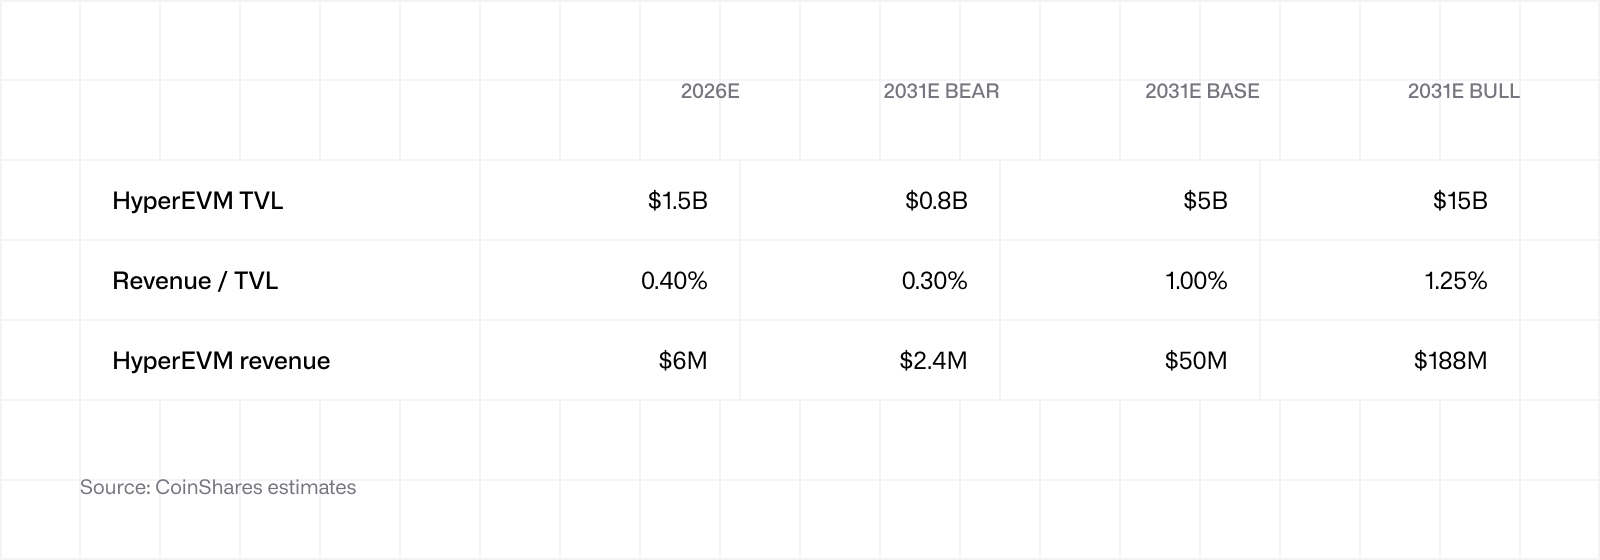 A titolo di confronto, dall’aggiornamento Dencun, la L1 di Ethereum genera in commissioni solo lo 0,1-0,25% del proprio TVL, mentre Solana si avvicina all’1% durante i periodi di attività intensa. Il nostro scenario bull dell’1,25% per HyperEVM si allinea sostanzialmente a Solana nei periodi di maggiore attività.
Nello scenario bear, il TVL diminuisce e rimane in gran parte inattivo.
5g. Rendimento della riserva USDC AQAv2
Il quadro AQA è stato precedentemente illustrato nella sezione 3. Oggi, con circa 5 miliardi di dollari in USDC sulla piattaforma che generano un rendimento a breve termine del 3,5-4%, il contributo annualizzato si attesta a circa 140-160 milioni di dollari. Si tratta di circa il 15% dei ricavi totali stimati per il 2026, una quota significativa.
Le proiezioni future si basano su due aspetti: l’offerta di USDC su Hyperliquid e i tassi di interesse. Non ci azzarderemo a prevedere quale sarà l’andamento dei tassi di interesse tra 5 anni perché, oltre a essere un’impresa inutile, qualunque previsione si rivelerebbe errata.
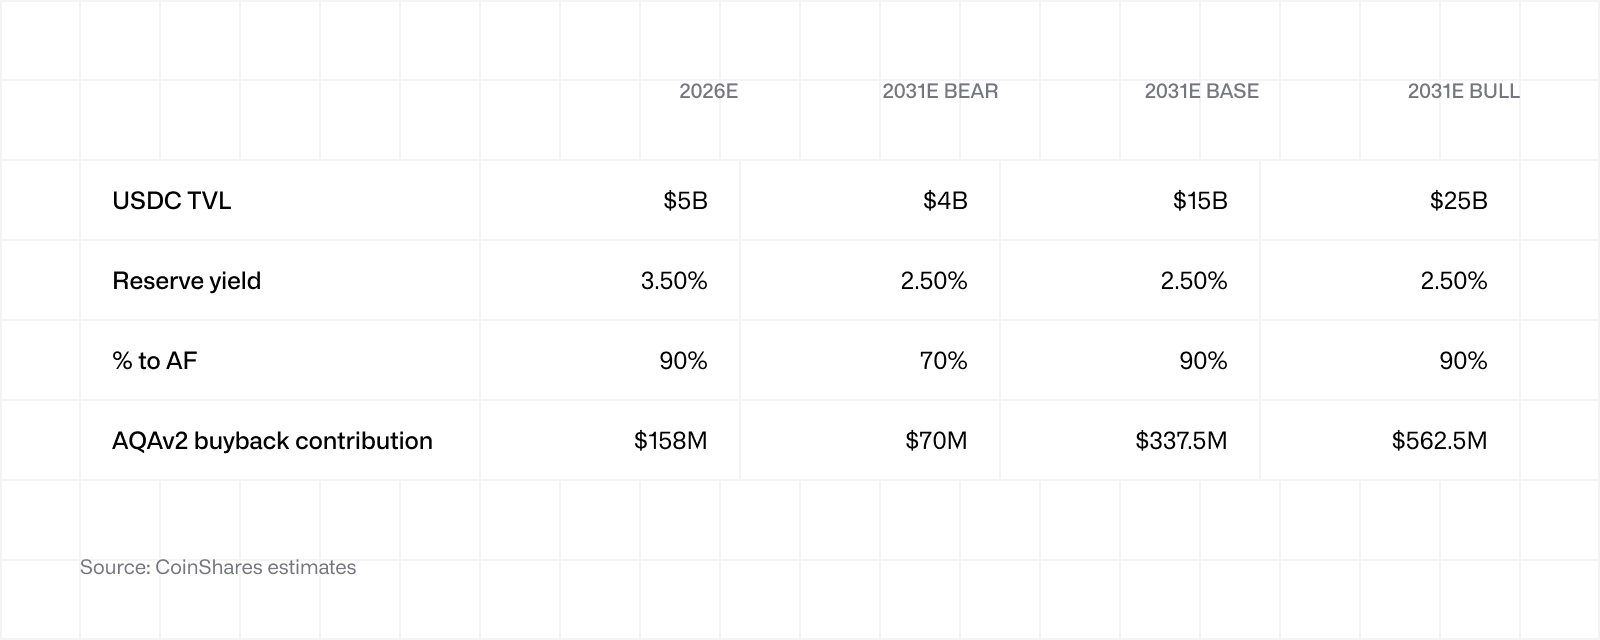 Ammettiamo che queste stime sono più approssimative rispetto a quelle delle altre sezioni. Ci aspettiamo che, negli scenari base e bull, l’offerta di USDC cresca insieme al protocollo, a ritmi diversi a seconda del livello di crescita. Nello scenario bear, l’offerta di USDC si contrae a causa della perdita di terreno di Hyperliquid rispetto alle blockchain concorrenti. Inoltre, per rendere questo scenario più negativo, ipotizziamo che le condizioni vengano rinegoziate e che il contributo al rendimento venga ridotto.
In tutti gli scenari abbiamo ipotizzato un tasso del 2,5%, per il semplice motivo che è inferiore al livello attuale e, rientrando tra le possibili traiettorie del tasso, potrebbe risultare un’ipotesi cautelativa. Un potenziale rialzo è rappresentato da tassi più elevati, mentre il rischio di ribasso è costituito da una politica di tassi zero (ZIRP), che tuttavia avrebbe probabilmente effetti secondari favorevoli per tutto l’ecosistema cripto.
6. Quadro di valutazione e metodologia
Dopo aver analizzato Hyperliquid nel dettaglio, la sua natura e il funzionamento dei fattori che ne determinano i ricavi dovrebbero risultare chiari. La relativa semplicità del nostro modello si basa sul meccanismo di buyback di HyperCore e sul meccanismo di burn di HyperEVM.
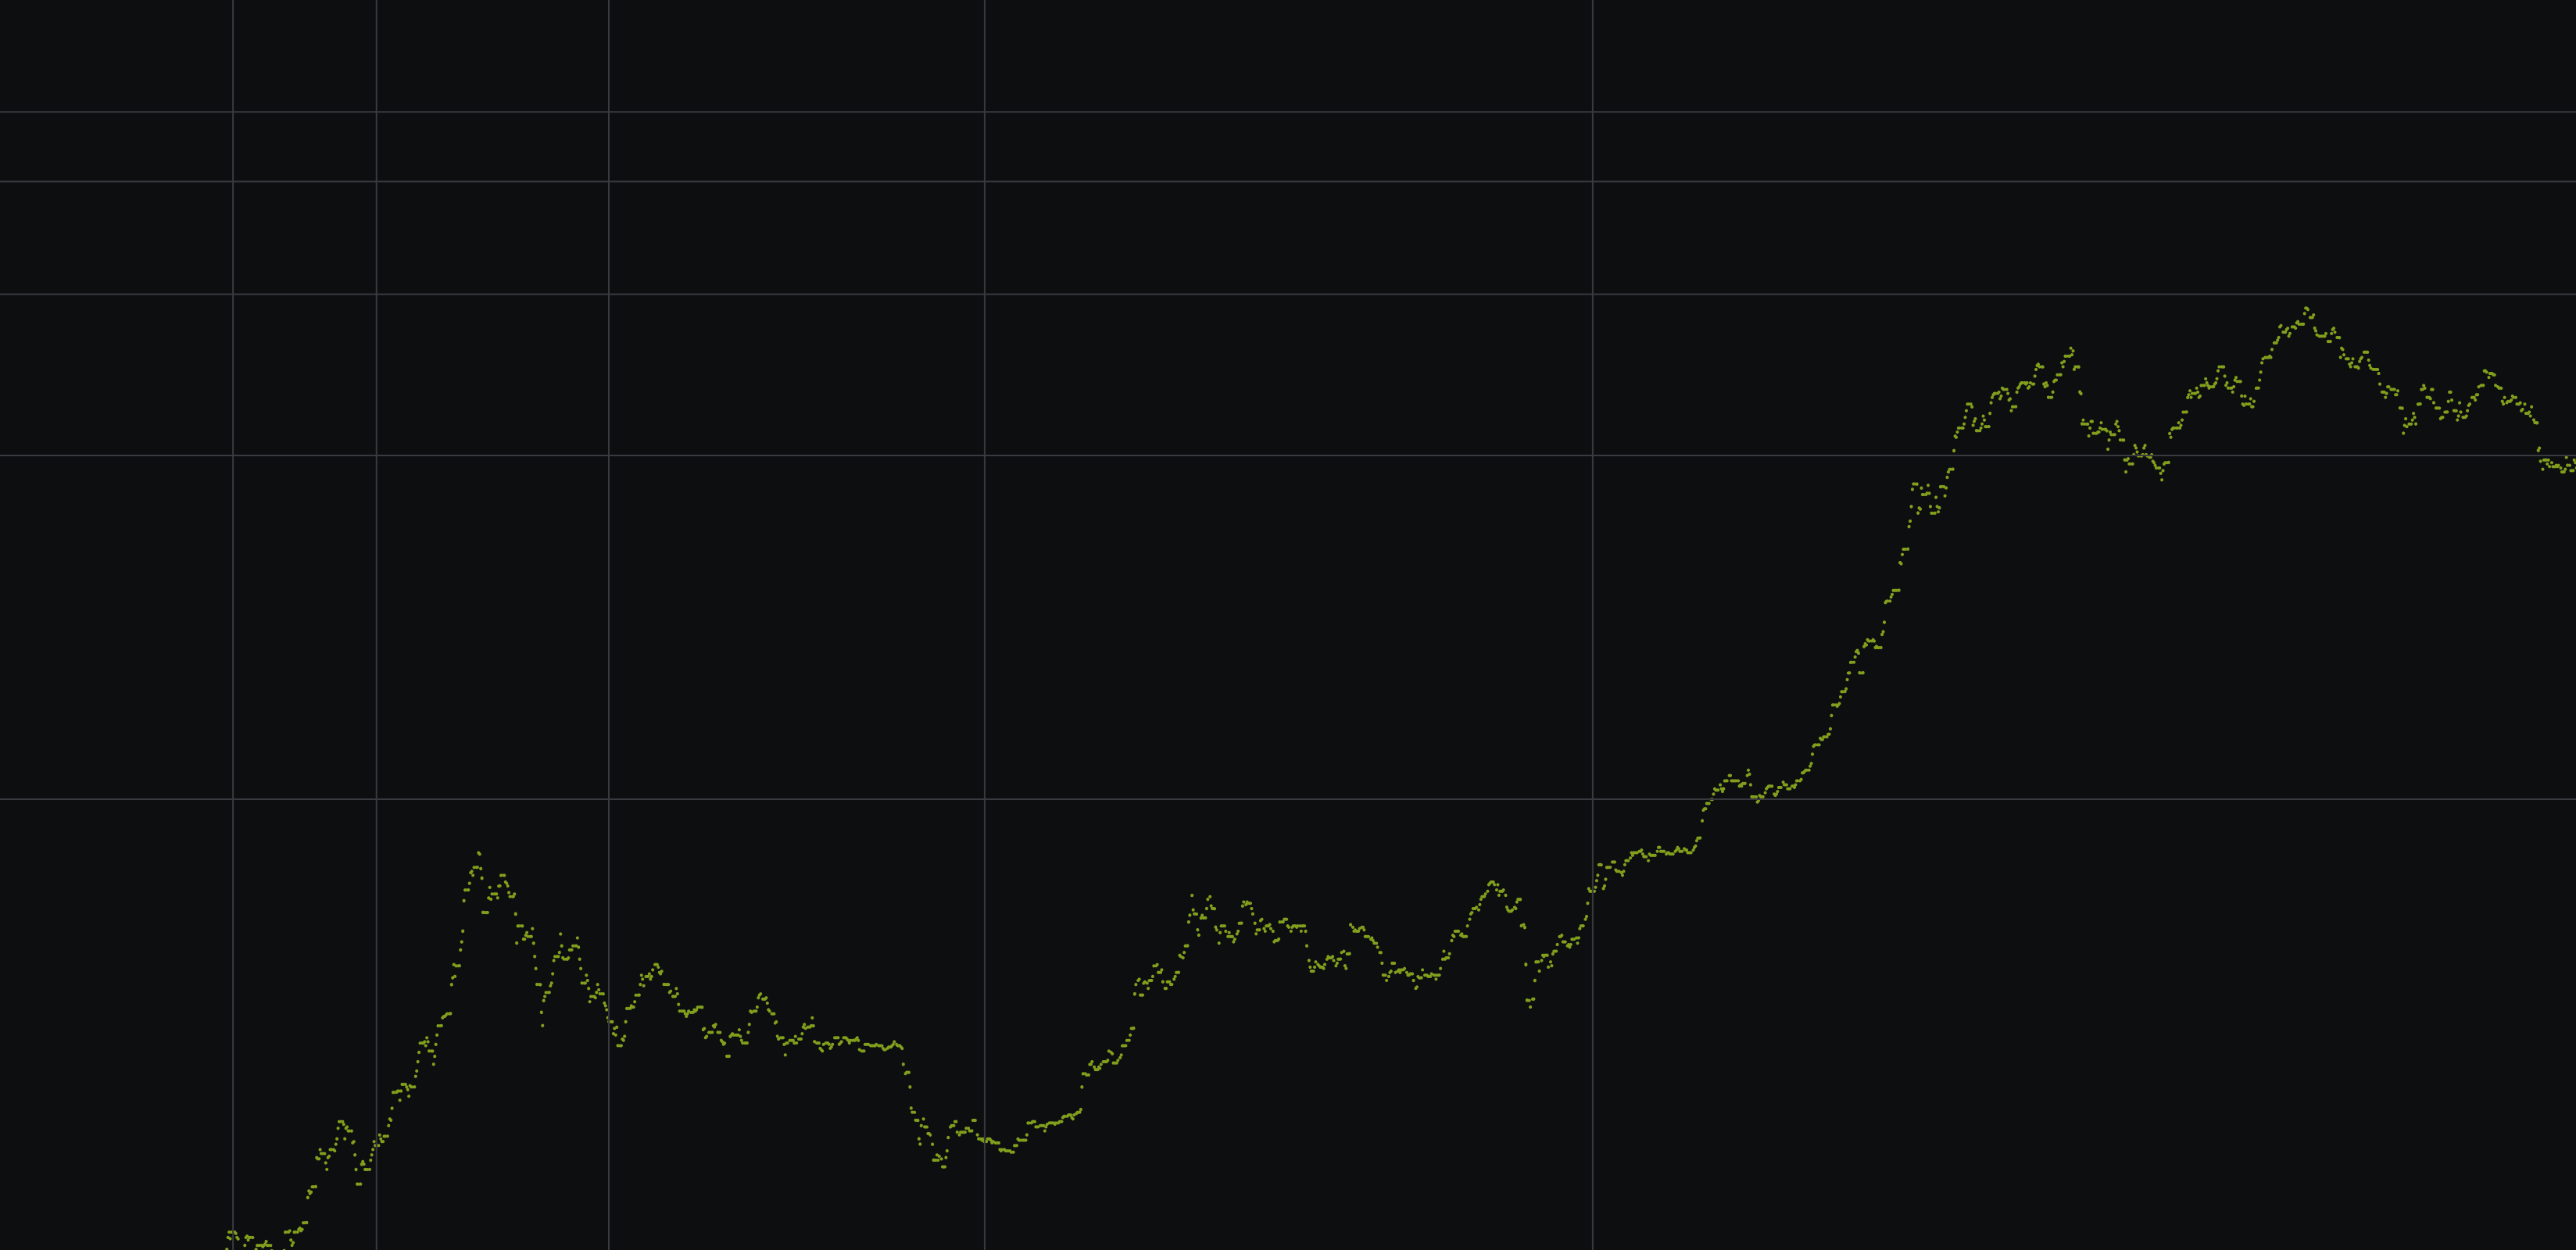
Applichiamo un multiplo P/Fees ai ricavi totali per determinare la capitalizzazione di mercato, quindi dividiamo tale risultato per l’offerta in circolazione al fine di ottenere un prezzo terminale implicito per il token in ciascuno degli scenari. Prima di approfondire l’argomento, ecco di seguito l’andamento storico del rapporto P/Fees relativo all’offerta in circolazione.
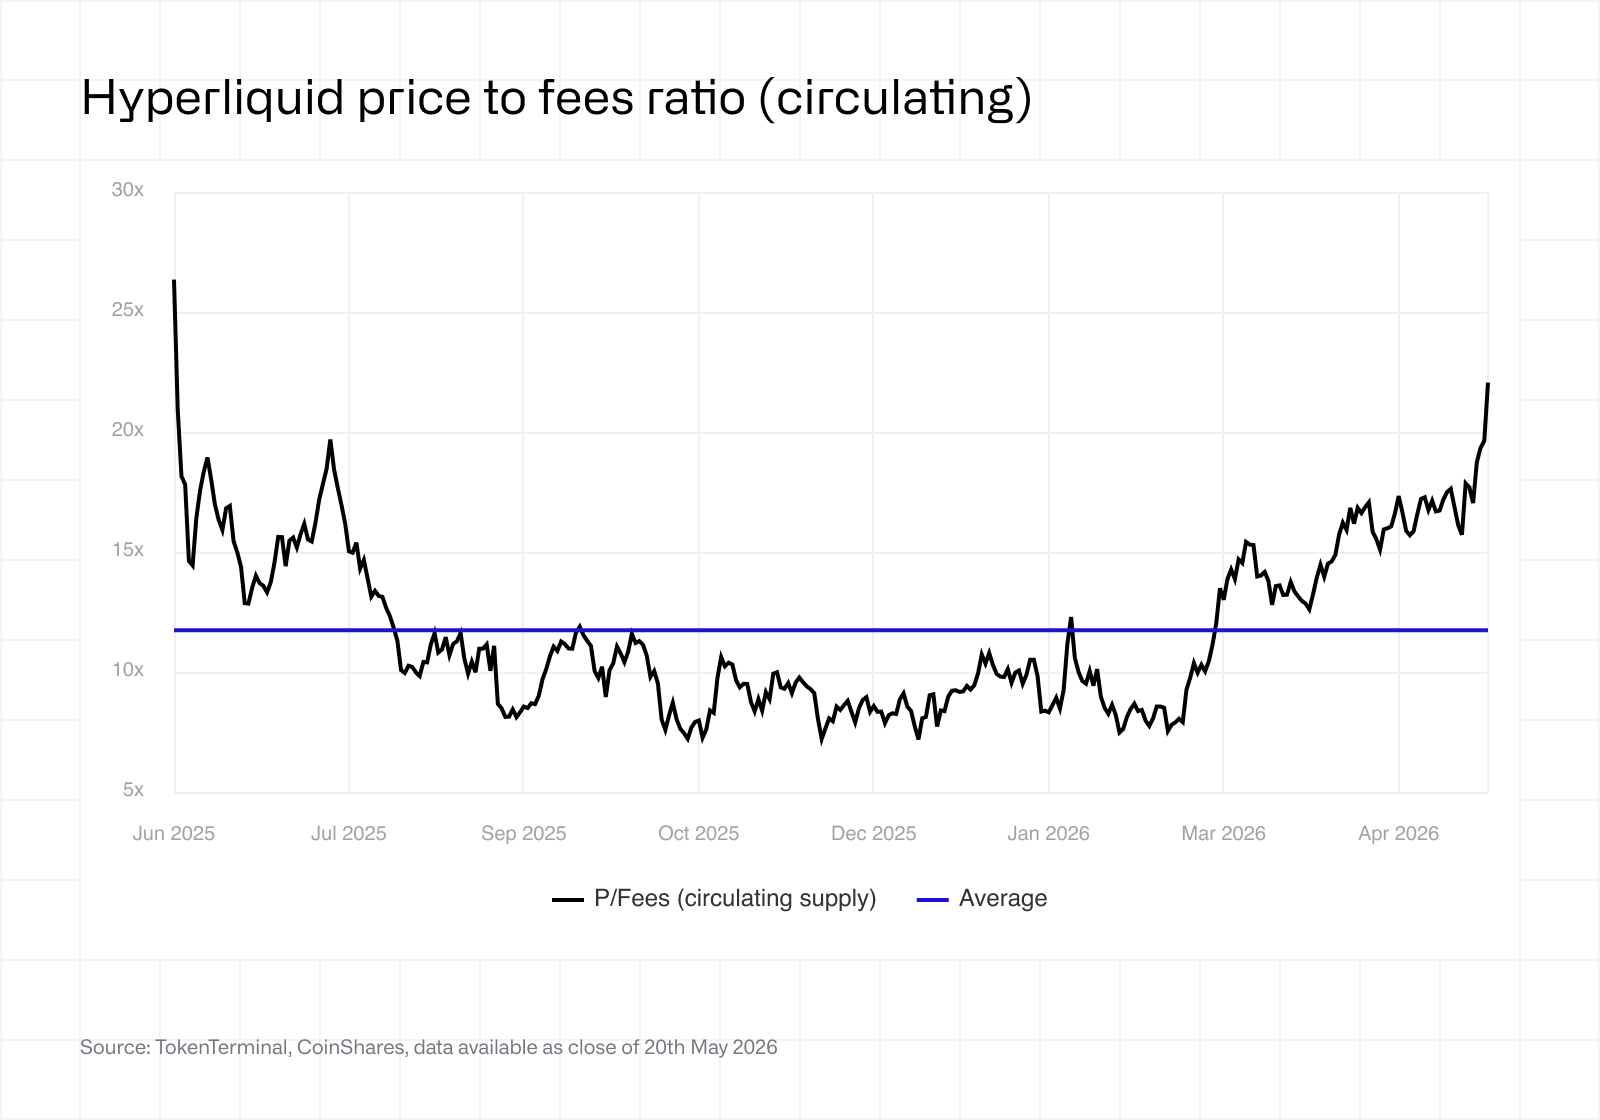 Il rapporto P/Fees medio attribuito dal mercato a Hyperliquid è pari a 11,78x. Naturalmente ci sono alcuni fattori esogeni che contribuiscono ad alimentare la volatilità di questo multiplo: ribassi generalizzati del mercato, grandi acquirenti, grandi venditori, frenesia speculativa, ecc.
Anziché cercare di stimare la quantità di token che verrebbero ritirati dalla circolazione attraverso il buyback, il che costituirebbe un ragionamento circolare, il buyback è integrato proprio all’interno del multiplo stesso.
Applichiamo i multipli 10x, 15x e 20x rispettivamente agli scenari bear, base e bull. Il multiplo 10x nello scenario bear è sostanzialmente in linea con la media storica. Il multiplo 15x nello scenario base è leggermente più elevato. Ciò riflette la nostra convinzione che, nel 2031, la base di ricavi di Hyperliquid sarà notevolmente più ampia e diversificata rispetto a oggi, il che giustifica una moderata rivalutazione. Il multiplo 20x nello scenario bull si colloca nella parte alta dell’intervallo storico, ma non lo supera.
Il multiplo P/Fees può anche essere espresso in maniera diversa. Ogni dollaro di ricavo destinato al programma di buyback rappresenta un rendimento per i possessori di HYPE, nello stesso modo in cui un dividendo o un buyback di azioni rappresenta un rendimento per gli azionisti. Dividendo l’importo annuale destinato al buyback per la capitalizzazione di mercato si ottiene un “rendimento da buyback”.
Utile come indicatore istantaneo, questo rendimento mostra, sotto una prospettiva diversa, le situazioni in cui HYPE potrebbe essere sopravvalutato o sottovalutato nel breve termine. Sebbene sia tautologico rispetto al multiplo P/Fees, questo quadro permette di confrontarlo con le opportunità di investimento offerte da titoli azionari consolidati.
I multipli più elevati applicati negli scenari base e bull riflettono la volontà futura di accettare un rendimento da buyback inferiore man mano che i rischi di HYPE si attenuano nel tempo, parallelamente alla maturazione del protocollo e alla diversificazione della sua base di ricavi.
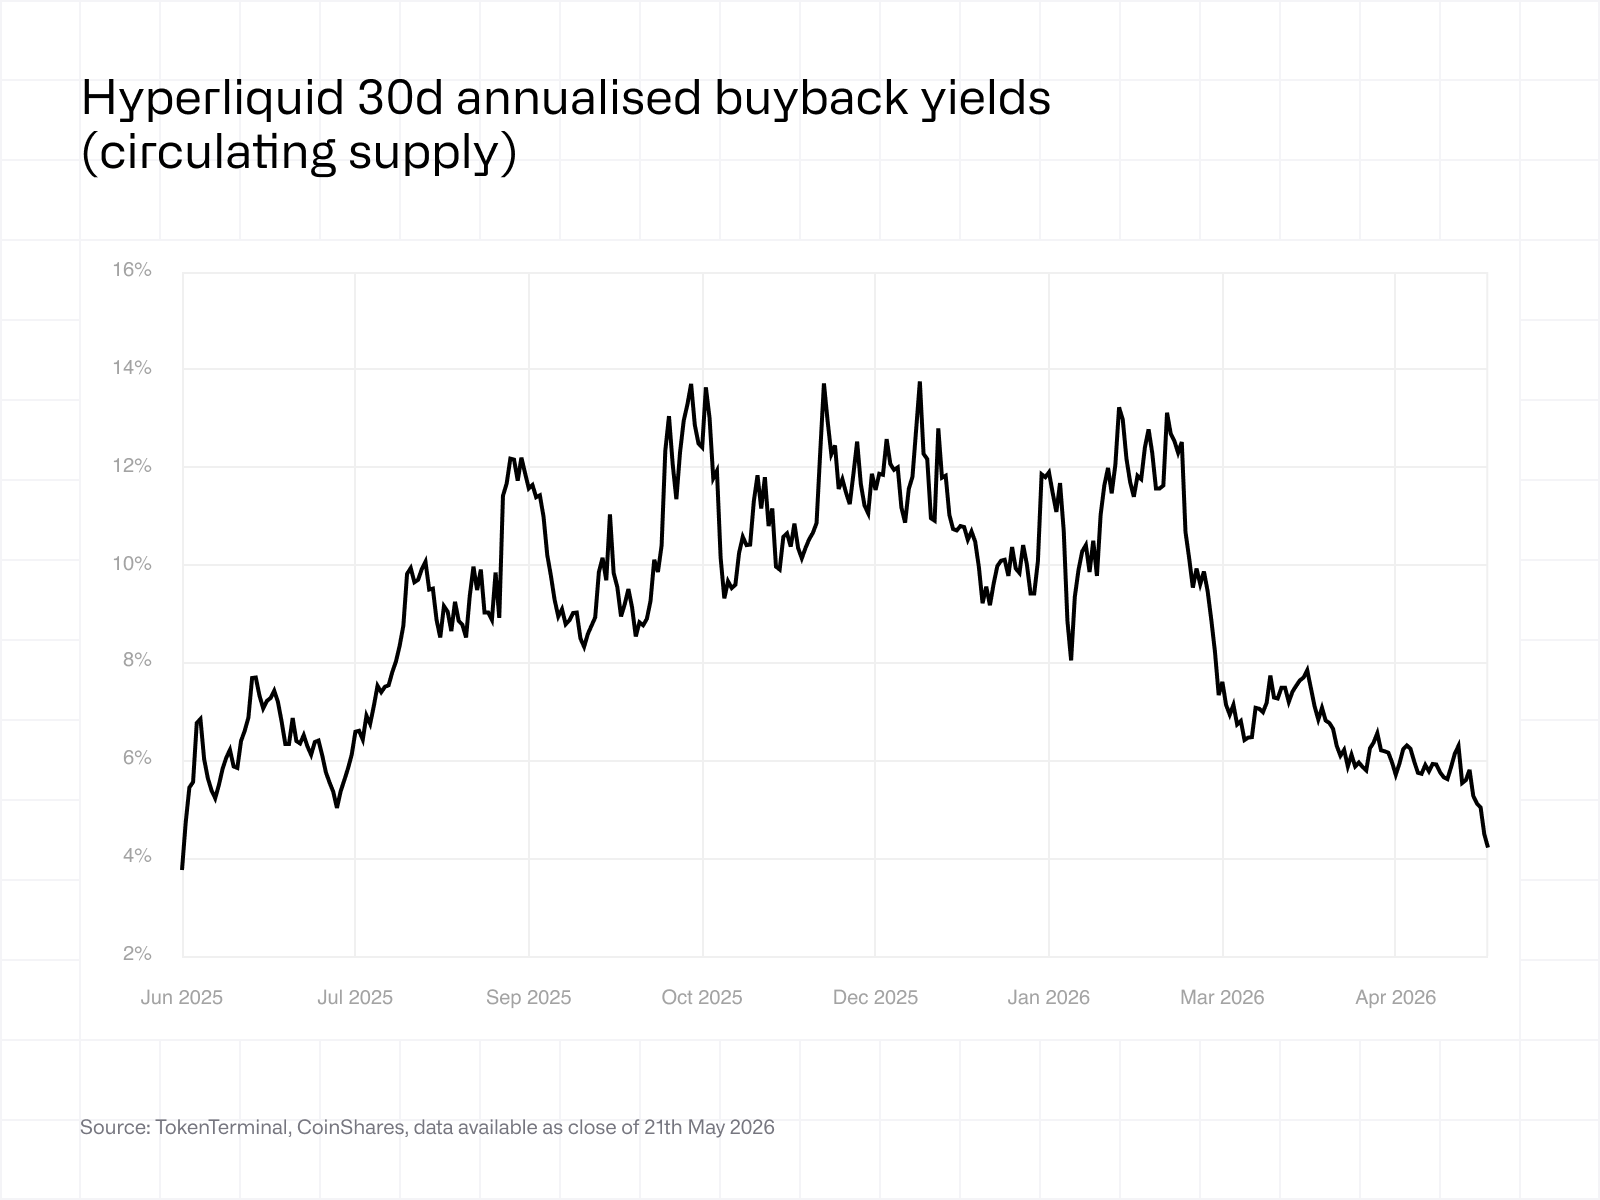 Come si evince dal precedente grafico sull’andamento del rendimento da buyback, HYPE ha oscillato tra il circa 4% e il circa 14% negli ultimi 12 mesi. Il rendimento attuale si colloca nella fascia bassa di questo intervallo, coerentemente con il multiplo attuale più elevato. Considerato il recente rialzo di HYPE, è possibile che sia sopravvalutato nel brevissimo termine.
Data la natura programmatica del buyback da parte dell’AF come flusso di cassa ricorrente, in questo caso è teoricamente applicabile un approccio DCF. Abbiamo scelto i multipli come quadro di riferimento principale per i motivi sopra descritti, ma vale comunque la pena mostrare anche i risultati ottenuti da un’analisi DCF.
Questo metodo si basa su un approccio classico in due fasi: proiettare il flusso del buyback su un orizzonte temporale di 5 anni in base ai CAGR dei nostri scenari, e poi applicare un valore terminale alla scadenza del quinto anno utilizzando un tasso di crescita perpetua del 5%. Applichiamo questo modello utilizzando tre tassi di attualizzazione (12%, 15% e 18%) al fine di coprire la fascia tipica del costo del capitale proprio nel settore delle cripto-attività.
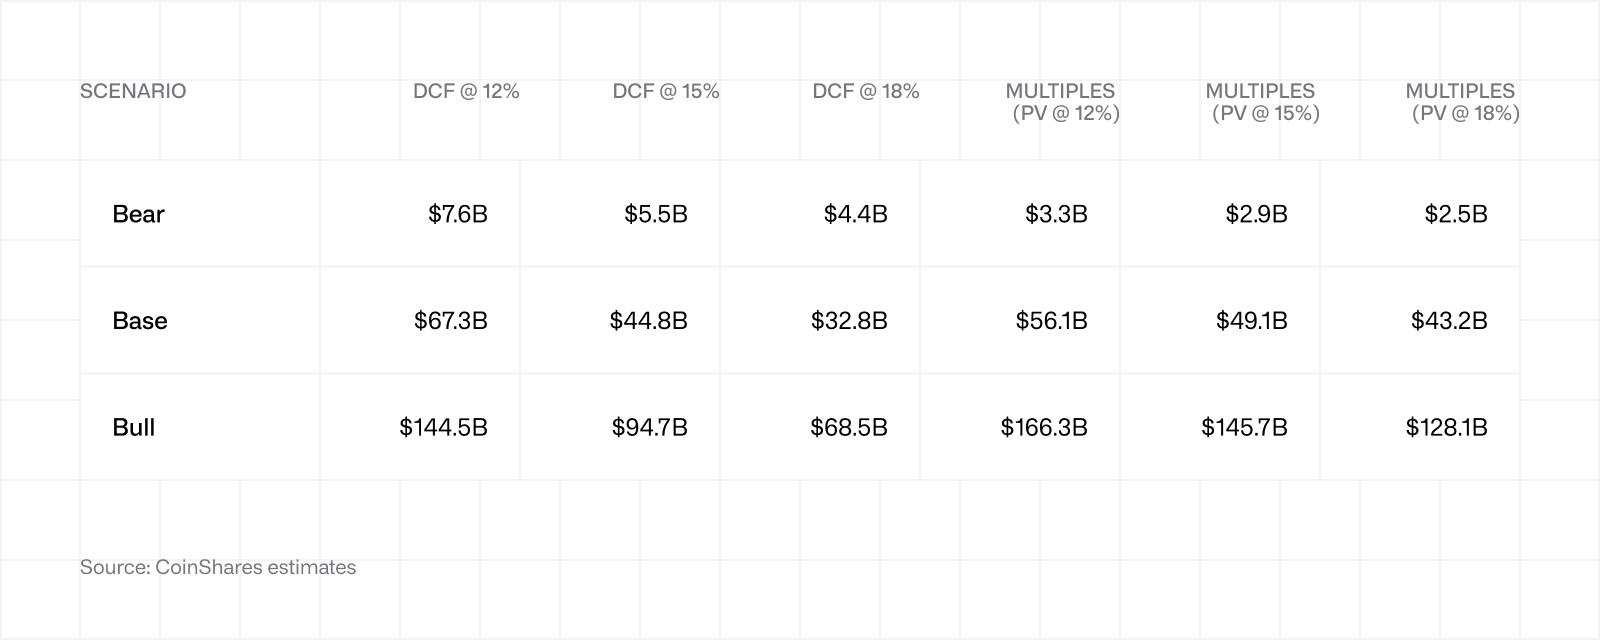 I due approcci portano a risultati relativamente simili nello scenario base, indipendentemente dal tasso di attualizzazione utilizzato. Agli estremi, invece, divergono in direzioni opposte. Nello scenario bear, l’approccio basato sui multipli risulta più conservativo rispetto al metodo DCF, poiché un multiplo 10x applicato a ricavi ridotti è più penalizzante rispetto a un flusso di cassa che mantiene un certo valore terminale. Nello scenario bull, invece, i multipli portano a un risultato superiore a quello del metodo DCF, poiché tengono conto di elementi che un modello basato esclusivamente sui flussi di cassa non considera, ovvero l’opzionalità, gli effetti rete e la dinamica di buyback che riduce l’offerta stimolando al contempo la domanda.
7. Sintesi della valutazione
Combinando i sette flussi di ricavo, il modello basato sui multipli e i meccanismi dell’offerta, otteniamo il quadro generale riportato di seguito.
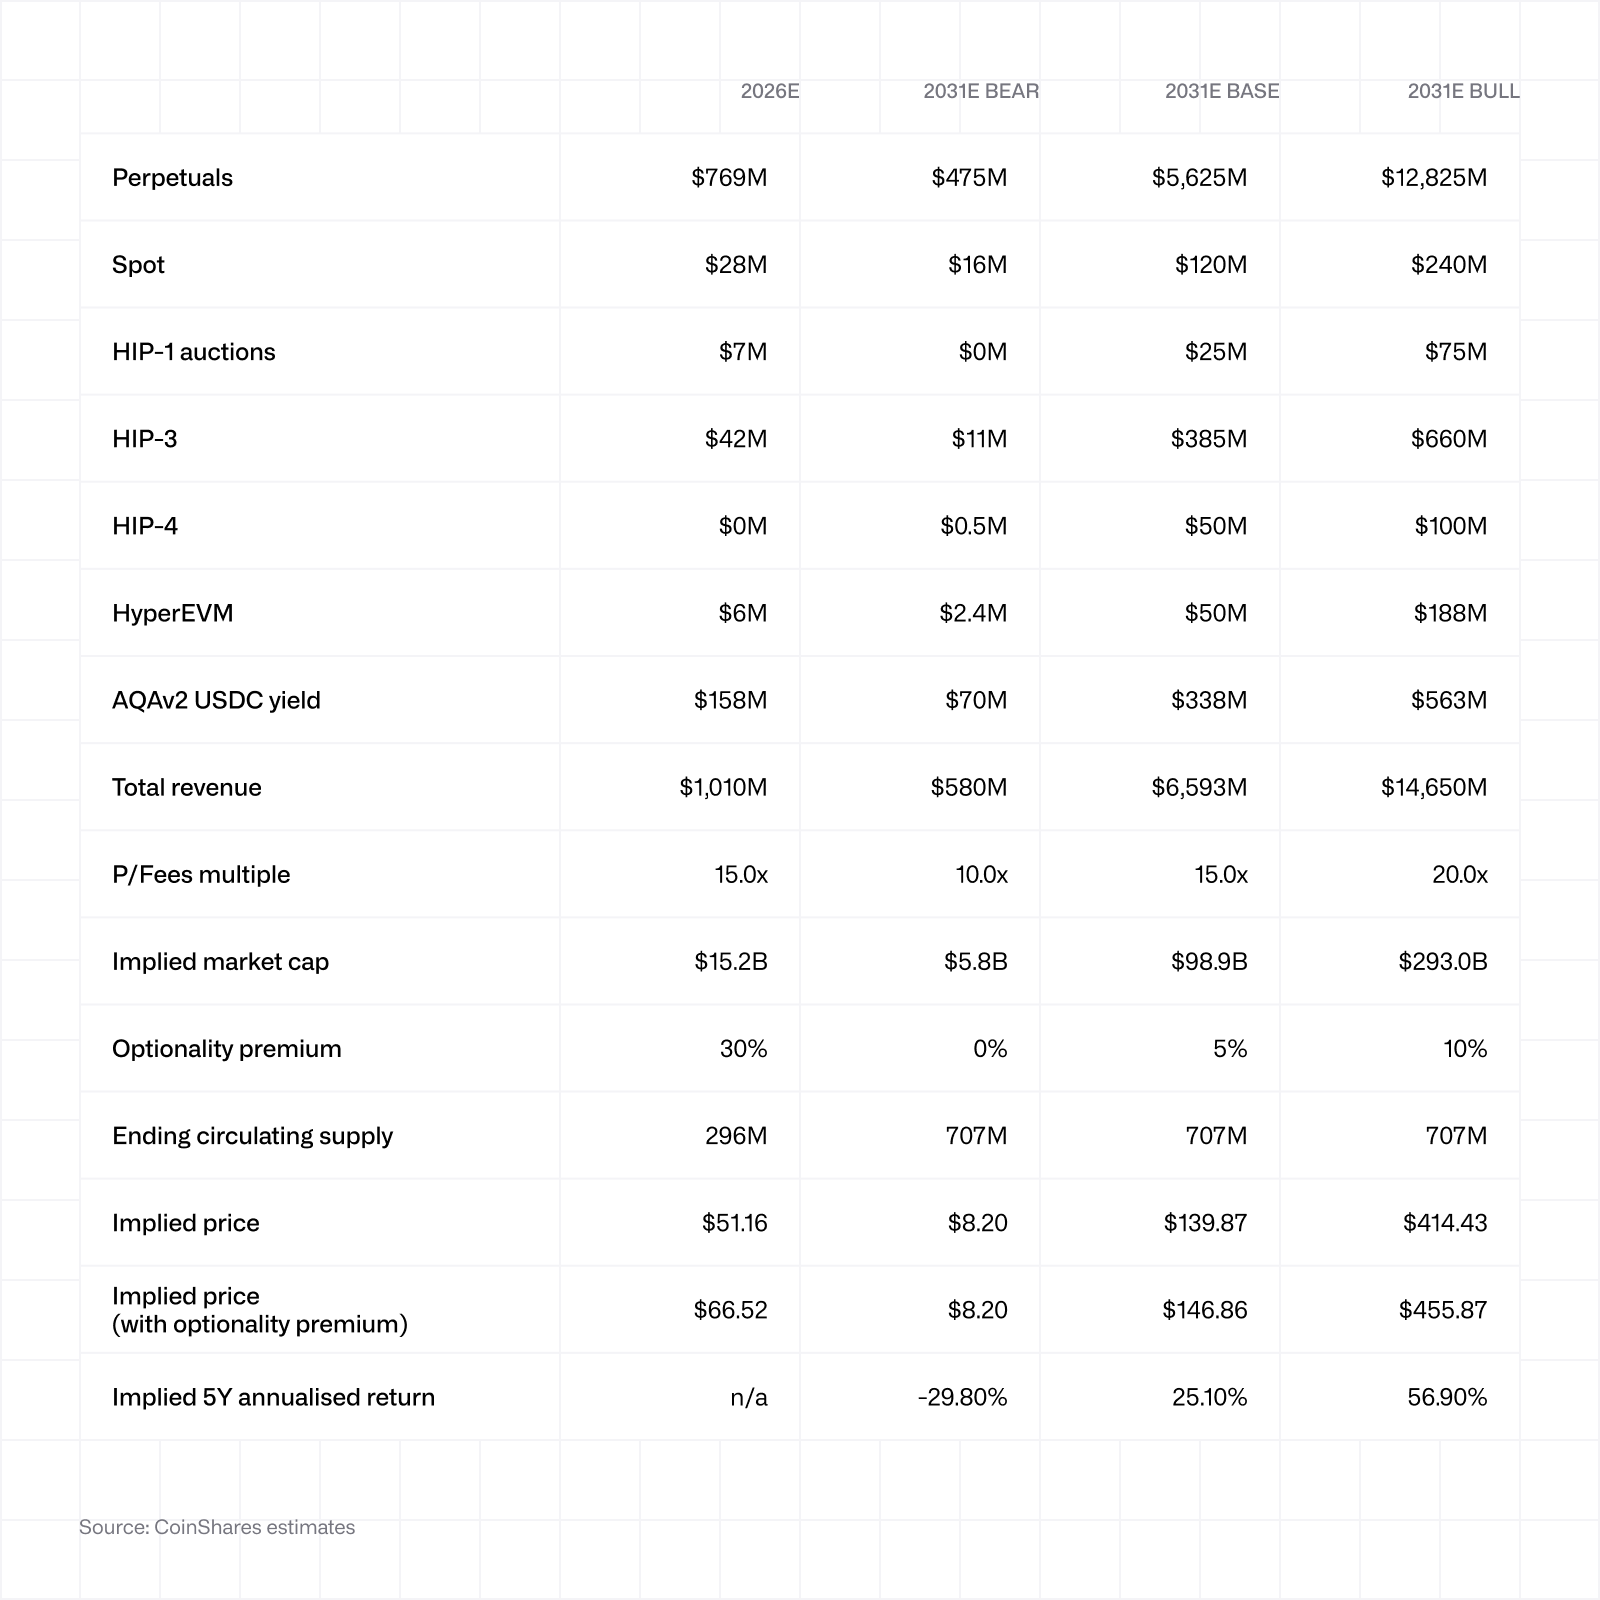 Al prezzo spot attuale, lo scenario base prevede un rendimento annualizzato di circa il 25% su cinque anni, contro circa il 57% dello scenario bull e circa il -30% dello scenario bear.
Premio per l’opzionalità - Viene applicato a integrazione della capitalizzazione di mercato basata sui multipli per cogliere ciò che il nostro modello non quantifica esplicitamente: il valore della capacità di HyperCore di lanciare nuovi prodotti (le iniziative HIP-5 o successive non sono integrate nel nostro modello, ma gli sviluppatori hanno dimostrato una grande capacità di portare a termine i lanci con successo), gli effetti rete derivanti dall’essere la principale piattaforma di negoziazione on-chain, nonché la riflessività del meccanismo di buyback, che genera una pressione all’acquisto amplificata dalla crescita della piattaforma. Riflette inoltre la frenesia speculativa, particolarmente marcata nel breve termine e vero e proprio motore delle fluttuazioni del prezzo delle criptovalute.
Questo premio rappresenta la componente meno precisa del nostro modello. Gli umori possono cambiare rapidamente e far oscillare i prezzi in modo significativo in brevi periodi di tempo. Le notevoli variazioni osservate nel precedente grafico sull’andamento storico del rapporto P/Fees possono essere in gran parte attribuite proprio a questo fattore residuo non spiegato. Fissiamo questo premio al 30% per le stime relative al 2026 al fine di riflettere sia l’attuale visibilità dell’opzionalità, sia la dinamica speculativa a breve termine. Tale premio viene poi ridotto al 5% nello scenario base e al 10% nello scenario bull, poiché gran parte di tale opzionalità è già riflessa nei dati relativi ai ricavi del 2031. Lo scenario bear non prevede alcun premio, poiché presuppone che la tesi di fondo della piattaforma non si materializzi.
Il nostro prezzo implicito di 66,52 $ per la stima del 2026 si attesta leggermente al di sopra del prezzo spot attuale. Interpretiamo questo dato come un segnale che il nostro modello è conservativo. Nel frattempo, il mercato sta incorporando nel prezzo un mix di aspettative di crescita futura e frenesia di breve termine. “Nel breve periodo il mercato è una macchina elettorale, ma nel lungo periodo è una bilancia.”
L’offerta in circolazione è un altro elemento particolarmente difficile da prevedere. Emissioni più elevate o limitate possono influire sul risultato, e il buyback non è prevedibile a causa della sua relazione circolare con il prezzo. Pertanto, è probabile che le nostre stime risulteranno notevolmente superiori o inferiori all’effettiva offerta in circolazione.
8. Rischi
Investire nel token HYPE comporta dei rischi significativi. Segue un elenco non esaustivo dei rischi che attualmente individuiamo:
Concorrenza: sebbene oggi Hyperliquid sia il leader indiscusso, il segmento dei DEX di contratti perpetui è dinamico. Aster ha conquistato una quota di mercato significativa a metà del 2025 prima di crollare (sebbene in un contesto di legittimità dubbia); questo ci ricorda che nessuna quota di mercato è permanente. Le piattaforme basate su Solana per la negoziazione di contratti perpetui, come Jupiter, Phoenix o nuovi operatori, potrebbero influire in modo significativo sulla capacità di Hyperliquid di mantenere o ampliare la propria quota di mercato.
Quadro normativo - Hyperliquid è soggetta a blocco geografico negli Stati Uniti, ma ciò non elimina i rischi normativi. La CFTC ha mostrato un’interesse crescente per i derivati on-chain. Il CME e l’ICE hanno già esortato le autorità di regolamentazione statunitensi a esaminare Hyperliquid, mentre i grandi nomi hanno un chiaro interesse a frenare la concorrenza on-chain.
Eccesso di offerta legato al team - L’allocazione riservata al team continuerà a essere rilasciata per tutto il 2027 e il 2028, con lo sblocco di una quota significativa previsto per novembre 2027. Sebbene finora le distribuzioni siano state nettamente inferiori a quanto previsto (come indicato nella sezione 3), non vi è alcuna garanzia che la situazione perduri. Per questo, in tutti i nostri scenari, abbiamo ipotizzato uno sblocco completo per tenere conto di questo fattore.
Eccesso di offerta legato alla comunità - Parte dell’offerta bloccata è riservata alla comunità. Un futuro airdrop potrebbe causare una forte pressione di vendita, che potrebbe incidere in modo significativo sui prezzi e rimettere in discussione alcune delle ipotesi formulate in precedenza.
Protocollo e rischi tecnici - Il gruppo di validatori di Hyperliquid rimane relativamente concentrato. Un attacco riuscito, un fallimento del meccanismo di consenso o un incidente legato al bridge USDC potrebbero comportare la perdita totale dei fondi degli utenti, con un impatto significativo sui prezzi e il rischio di rendere il token sostanzialmente privo di valore.
Rischio dell’uomo chiave - Jeff Yan e il team centrale hanno guidato lo sviluppo della piattaforma sin dal suo esordio. Attualmente questo rappresenta un punto di forza, ma si rivela anche un’arma a doppio taglio. Affidarsi a poche persone chiave per realizzare una visione a lungo termine può comprometterne l’esecuzione a causa della mancanza di diversificazione.
La tesi ribassista contraria - Il tasso di commissione di HIP-3 rimane basso fintantoché proseguono i rinnovi della Growth Mode. HIP-4 non riesce a trovare il giusto equilibrio tra prodotto e mercato. L’AQA viene rinegoziato quando Coinbase fa valere il proprio potere. I ricavi dei contratti perpetui aumentano, ma a un ritmo nettamente inferiore a quello previsto nel nostro scenario base, mentre il multiplo si restringe verso la sua media storica, o addirittura ben al di sotto di essa.
Rischio di concentrazione dei builder - trade.xyz rappresenta circa il 90% dell’open interest di HIP-3. Se trade.xyz dovesse fallire, incorrere in problemi legali o migrare altrove, ciò avrebbe un impatto significativo sulle proiezioni relative a HIP-3 (salvo l’ingresso di un nuovo builder di successo).
Nel tempo impiegato per leggere questo articolo, l’Assistance Fund ha riacquistato 960 HYPE.
Se invece sei andato direttamente alla fine… 3 HYPE.