Bitcoin mining report | Q2 2026
 37 minuti di lettura
- Bitcoin
- Mining
1. Executive summary
Q2 2026 pushed the listed mining sector below cash breakeven in aggregate. Bitcoin ended the quarter at US$58,400, less than half its October 2025 all-time high, while the hashrate sat roughly 50% below trend following the network's first six-month decline since the China ban, and the monthly average hash price set an all-time low of US$27.7/PH/s/day in June.
The weighted average ex-tax cash cost to produce one bitcoin among the listed miners was approximately US$75,500 in Q2 2026.
Three defining themes emerged during the quarter:
Paying to stop mining: Core Scientific paid US$41.9m to cancel 15 EH/s of next-generation Proto hardware. Keel ceased mining on 29 June and will record zero mining revenue in Q3, while at least 35 EH/s is scheduled to leave the publicly listed cohort as IREN and Cipher complete their exits. Keel and Cipher also sold down their BTC reserves while redirecting capital towards data-centre development.
Regulation is turning energised sites into scarce assets: At least 225 moratoriums or restrictions on data-centre development have now been recorded across 30 states, of which 151 remain in force, with New York introducing the first statewide pause. The US interconnection queue stands at roughly 2,600GW, more than the country's entire installed capacity, with data centres accounting for 87% of ERCOT's 410GW large-load queue. A recent transaction valued three fully leased AI data centres at approximately US$27m/MW, compared with below US$3m/MW for some listed miners' energised but unleased capacity. Existing grid access is becoming increasingly valuable.
The premium is priced, but the revenue has not yet materialised: Companies with contracted AI or HPC capacity trade at an average 12.9x EV/NTM sales, compared with 3.7x for the mining companies without contracts. Keel is the exception, trading at 18.3x despite having no signed tenant. More than US$100bn of disclosed backlog currently supports only around US$1.1bn of annualised AI/HPC revenue, with roughly 550MW billing against more than 4GW contracted. Valuations will increasingly depend on converting contracted capacity into billings.
2. Regulation is turning energised sites into scarce assets
A new constraint has emerged in the US that we believe is fundamentally repricing the asset base of listed miners: it is becoming increasingly difficult to build new data centres at all. At least 225 moratoriums or restrictions on data centre development have now been recorded across 30 states, of which 151 remain in force, according to tracking by ElectricChoice.
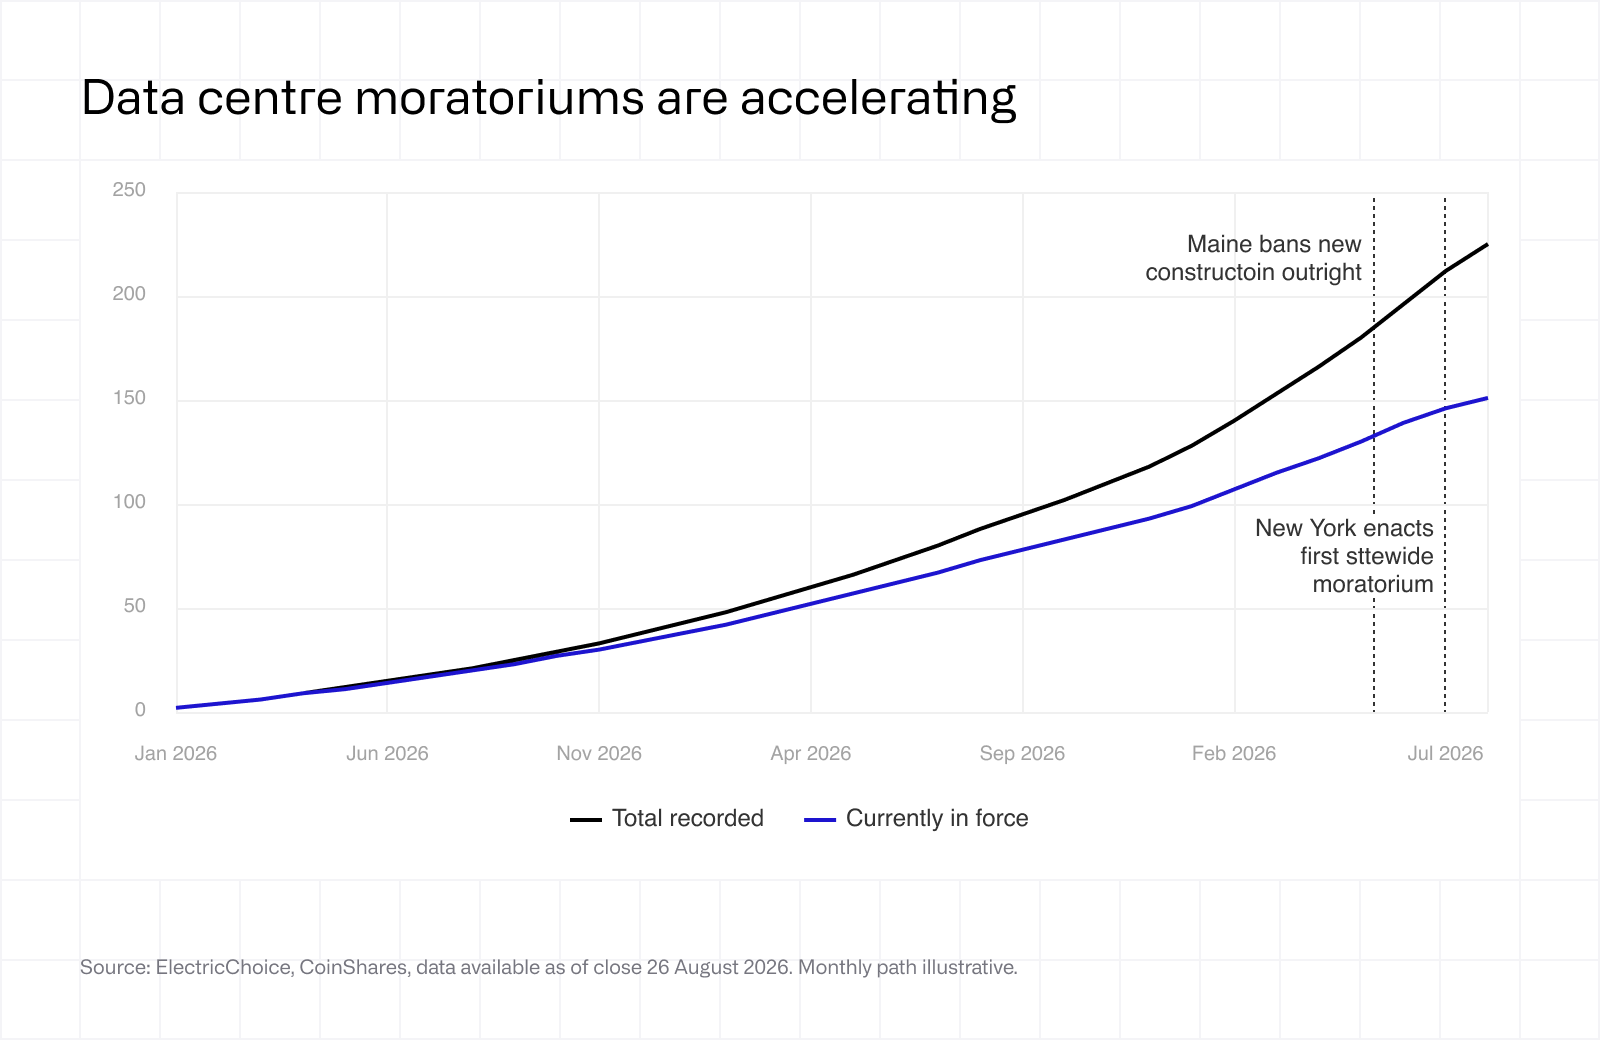
The most significant development came on 14th July 2026, when New York became the first state to enact a statewide moratorium, pausing environmental permits for facilities of 50MW or more for one year. Maine went further, banning new data centre construction outright in April 2026, while restrictions have proliferated at county level in Ohio, Michigan, Georgia and Indiana, where more than a third of counties have moved to limit development. Crucially, projects with completed permit applications are typically grandfathered, meaning existing approvals now carry option value that new entrants cannot replicate. The regulatory wall compounds an already severe grid bottleneck.
According to the Lawrence Berkeley National Laboratory's Queued Up research, the US interconnection queue backlog stands at roughly 2,600GW, roughly double the country's entire installed capacity, with the median wait from request to operation now exceeding five years for projects completed in 2025.
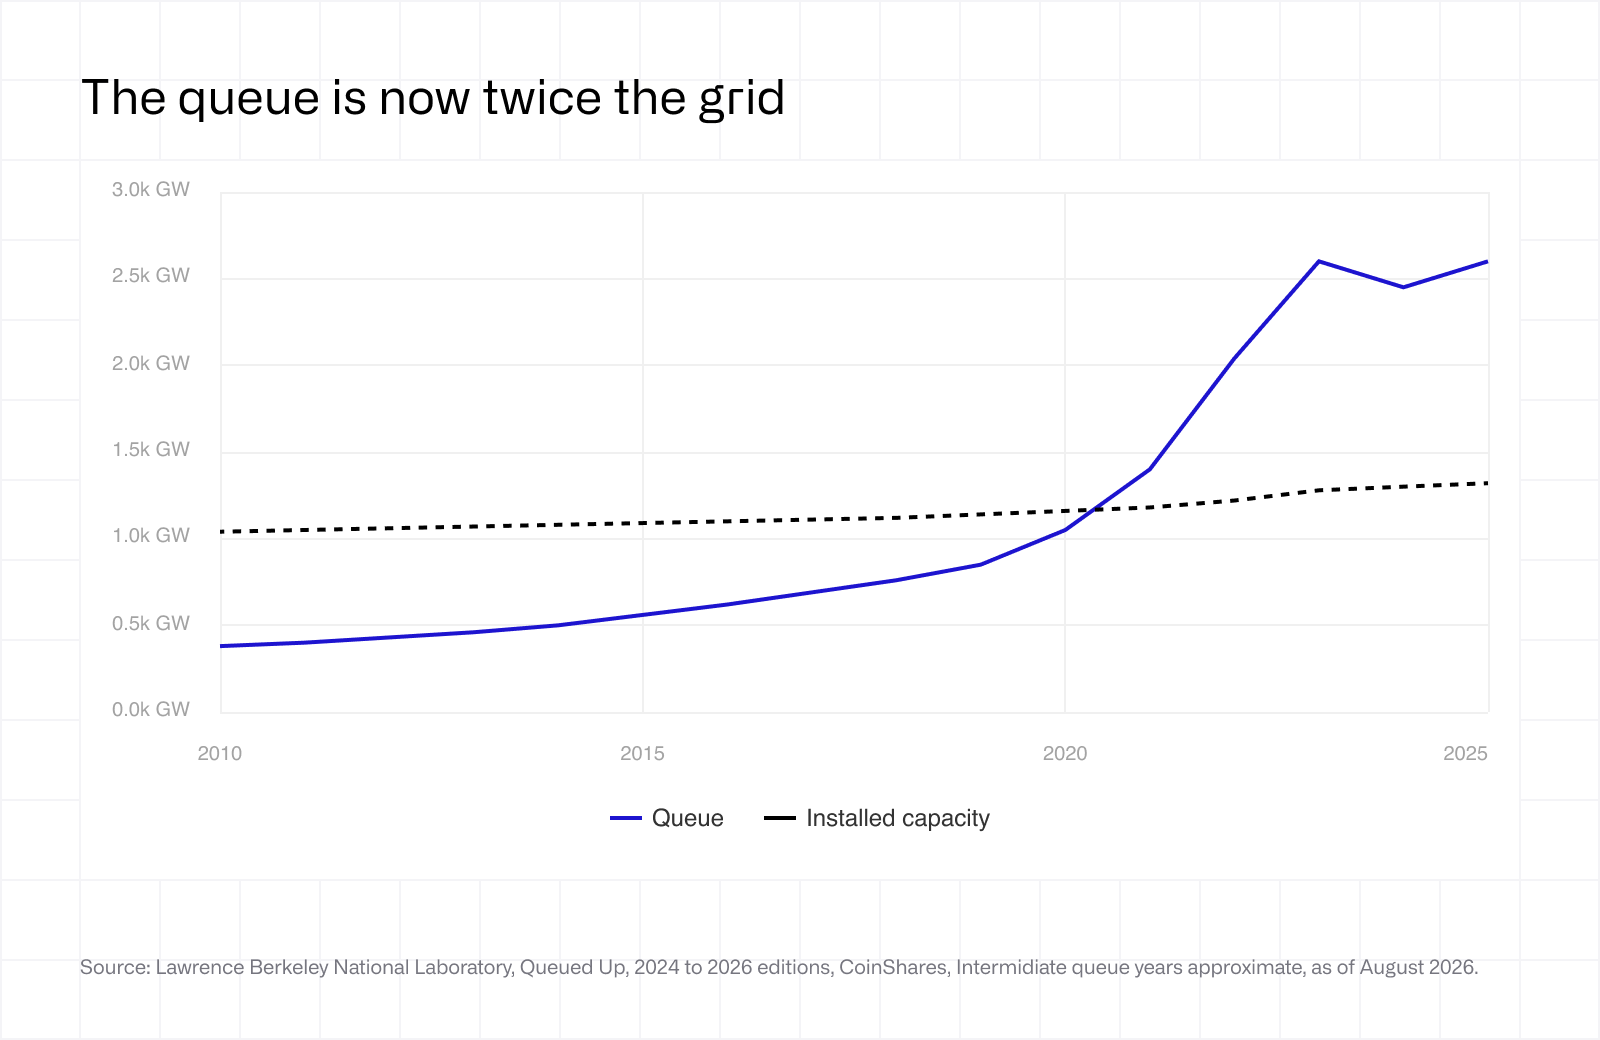
In the PJM region, projects entering service in 2025 took on average more than seven years from initial request to operation, while transformer lead times now exceed 160 weeks. ERCOT's own large load queue data show data centres accounting for 87% of a 410GW queue. The practical consequence is that an energised site cannot be recreated within any commercially relevant timeframe, regardless of capital available.
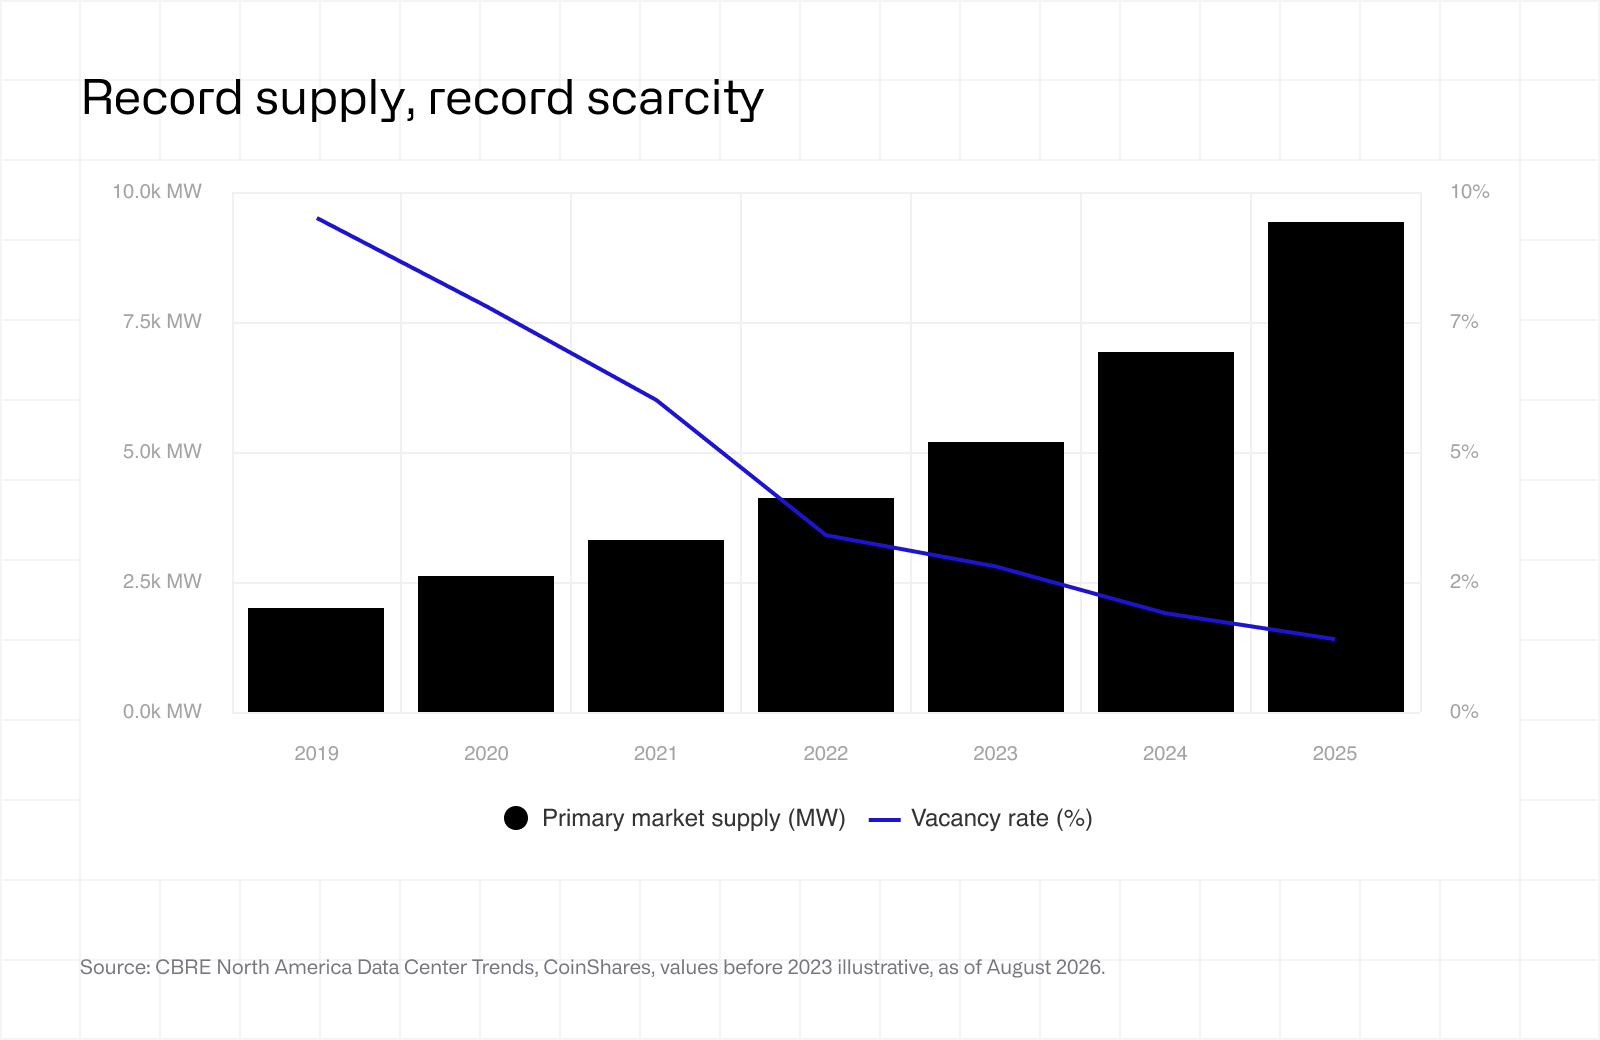
The market has responded by placing a substantial premium on capacity that already exists. According to CBRE, primary market vacancy fell to a record 1.4% at end 2025 despite supply growing 36% year on year, reaching just 0.3% in Northern Virginia by Q1 2026, while preleasing rates in the mid 70% range compare to the historical norm of 40 to 50%.
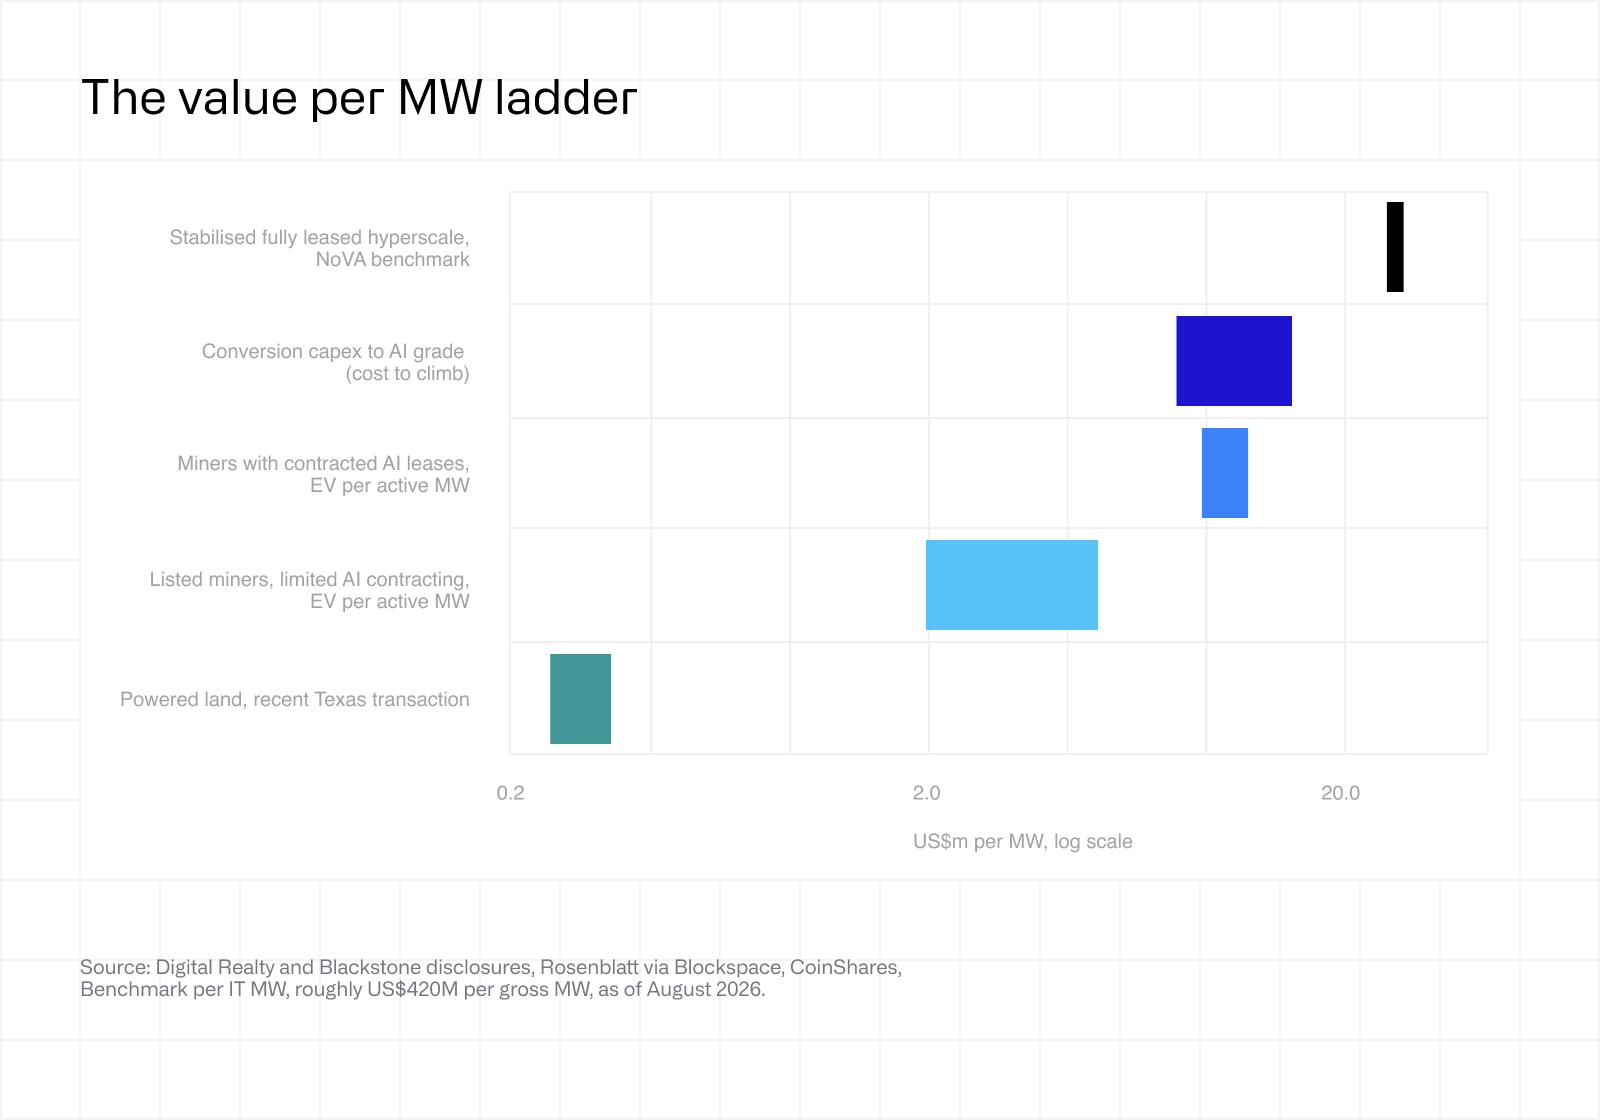
A recent US$3.5bn acquisition of three leased Northern Virginia AI facilities set a benchmark of approximately US$27m per MW for stabilised AI infrastructure. Listed miners with energised but unleased capacity currently trade at a fraction of this, in some cases below US$3m per MW, for assets that require only a tenant rather than a permit.
The repricing is perhaps best illustrated by one listed miner, which rejected an approach valuing the company at just over US$1bn in 2024 and agreed a US$9bn all-stock sale a year later, a near ninefold uplift for essentially the same 1.3GW footprint, with shareholders then rejecting even that price as inadequate in October 2025. More recently, another large operator agreed to pay up to US$600m, roughly US$300,000 per MW, for a Texas land site with rights to 2GW of grid capacity and no existing structures, and its shares rose 15% on the announcement.
We would caution that energised capacity is a necessary rather than sufficient condition. Converting mining infrastructure to AI grade facilities costs an estimated US$8m to US$15m per MW against US$0.7m to US$1m for mining, so the premium accrues most to operators with credible retrofit paths and contracted tenants. Nonetheless, the direction of travel is clear: regulation and grid congestion have inverted the historic discount applied to mining sites, converting what was once viewed as stranded, low grade infrastructure into some of the scarcest permitted power capacity in the US.
3. Paying To stop mining
In Q2, Core Scientific paid US$41.9m to terminate its agreement with Block's Proto division, cancelling approximately 15 EH/s of next-generation 3nm chip deliveries. Those chips are, to date, the most efficient mining hardware ever produced. The mining operation Core Scientific runs is deliberately loss making, with self-mining gross margin coming in at -56%. Management stated that it currently operates its remaining rigs purely to offset contractual power obligations while sites convert.
The headline of this section is purposefully bold, and it is a culmination of what we have seen over the last two years, in that many Bitcoin miners are continuing their transition into either hybrid bitcoin mining and hosted compute operations, or pure hosted compute, moving away from what they now refer to as their legacy business. Numerous examples have marked Q2 in this way:
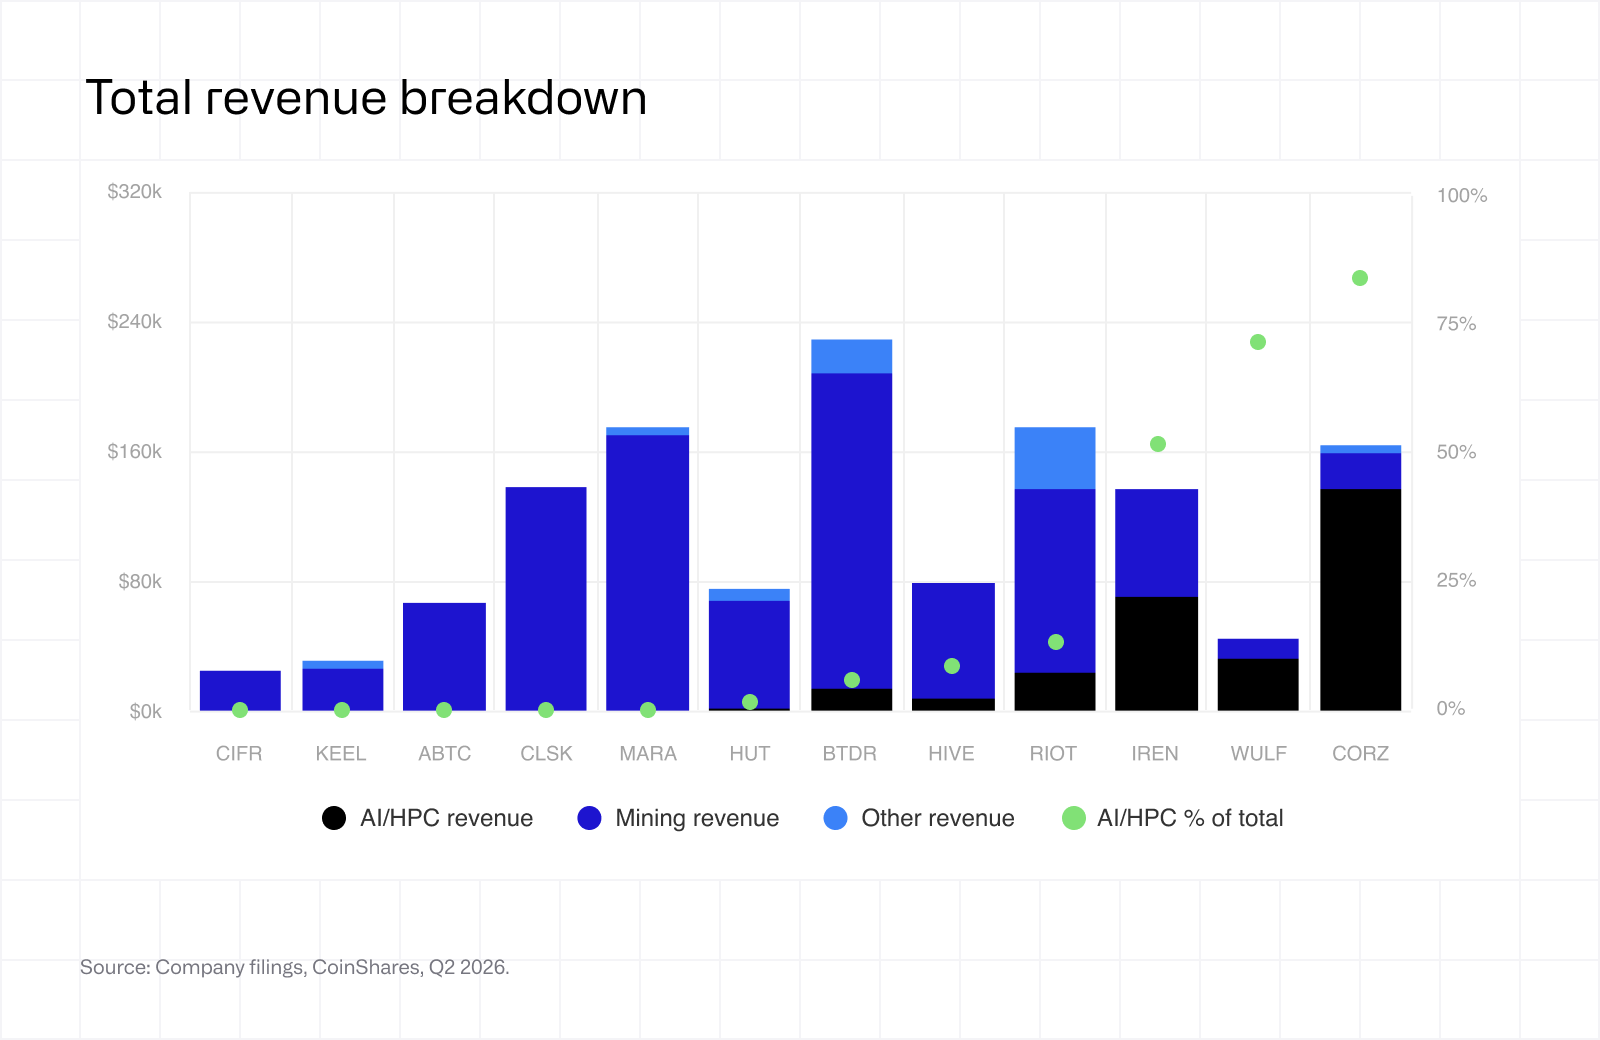 Keel (formerly Bitfarms) has now officially shut down its Bitcoin mining operations. Its Moses Lake location stopped mining in April, and its Panther Creek, Scrubgrass and Sharon locations stopped on the 29th of June. A reflection of this was seen in its -285% gross margin for Q2, as it accelerated the depreciation of retired mining equipment through its cost of revenues. Its Q3 mining revenue will be zero. It is the first listed miner to reach that number. Keel also sold 1,085 BTC (US$75m) at an average price of US$69,100. As of the 7th of August, it holds a mere 1,861 coins, and has stated its intention to liquidate the entire position before year-end.
Cipher Digital (formerly Cipher Mining) stated there will be no further mining capex, and that it expects mining to be immaterial by 2030, and likely exited by end of 2027. It mined 346 BTC in Q2, entirely from its Odessa site, which boasts a fixed power contract near 2.8 cents per kWh. Much like Keel, Cipher Digital sold Bitcoin to the tune of US$123.4m in H1 2026, at a US$47.7m realised loss: selling below cost to fund buildings for tenants. It is left with 646 BTC.
IREN stated in its 10-K that its transition from mining to AI will be substantially complete by the 31st of December 2026. Its latest quarter shows a US$450.4m impairment from decommissioning mining hardware, as well as a US$102.1m markdown on rigs held for sale. Further to this, IREN recorded US$25.1m of disposal losses. Fittingly, AI cloud revenue (US$70.5m) overtook mining revenue (US$66.7m) for the first time. As it stands, IREN holds no bitcoin at all (it has almost always sold its daily production).
TeraWulf is also deepening its pivot to AI. Two miner buildings at Lake Mariner were retired in H1 2026, resulting in a US$25.7m impairment on mining assets as well as a reduction in the useful lives on the rest. HPC leases now represent 71% of TeraWulf's total revenue, and the mining disclosure has been demoted to match: the 179 BTC it mined in Q2 appears nowhere in the release or on the call, only in the 10-Q.
Bitdeer now holds 150 BTC, down from 1,502 a year earlier, after US$195.5m of disposals in the quarter. HIVE sold 918 of the 1,004 coins it mined in Q2, with a further 46 pledged as equipment deposits, effectively funding rigs with coins as they are produced.
Bitcoin mining is not dying. We are witnessing a large cohort of public miners shift their business models to capture what is a lucrative and seemingly secular tailwind. As will be discussed in the next section of this report, hashrate is changing hands, and ultimately, the price of one bitcoin can and will change the economics of these decisions.
4. Network hashrate and hash price
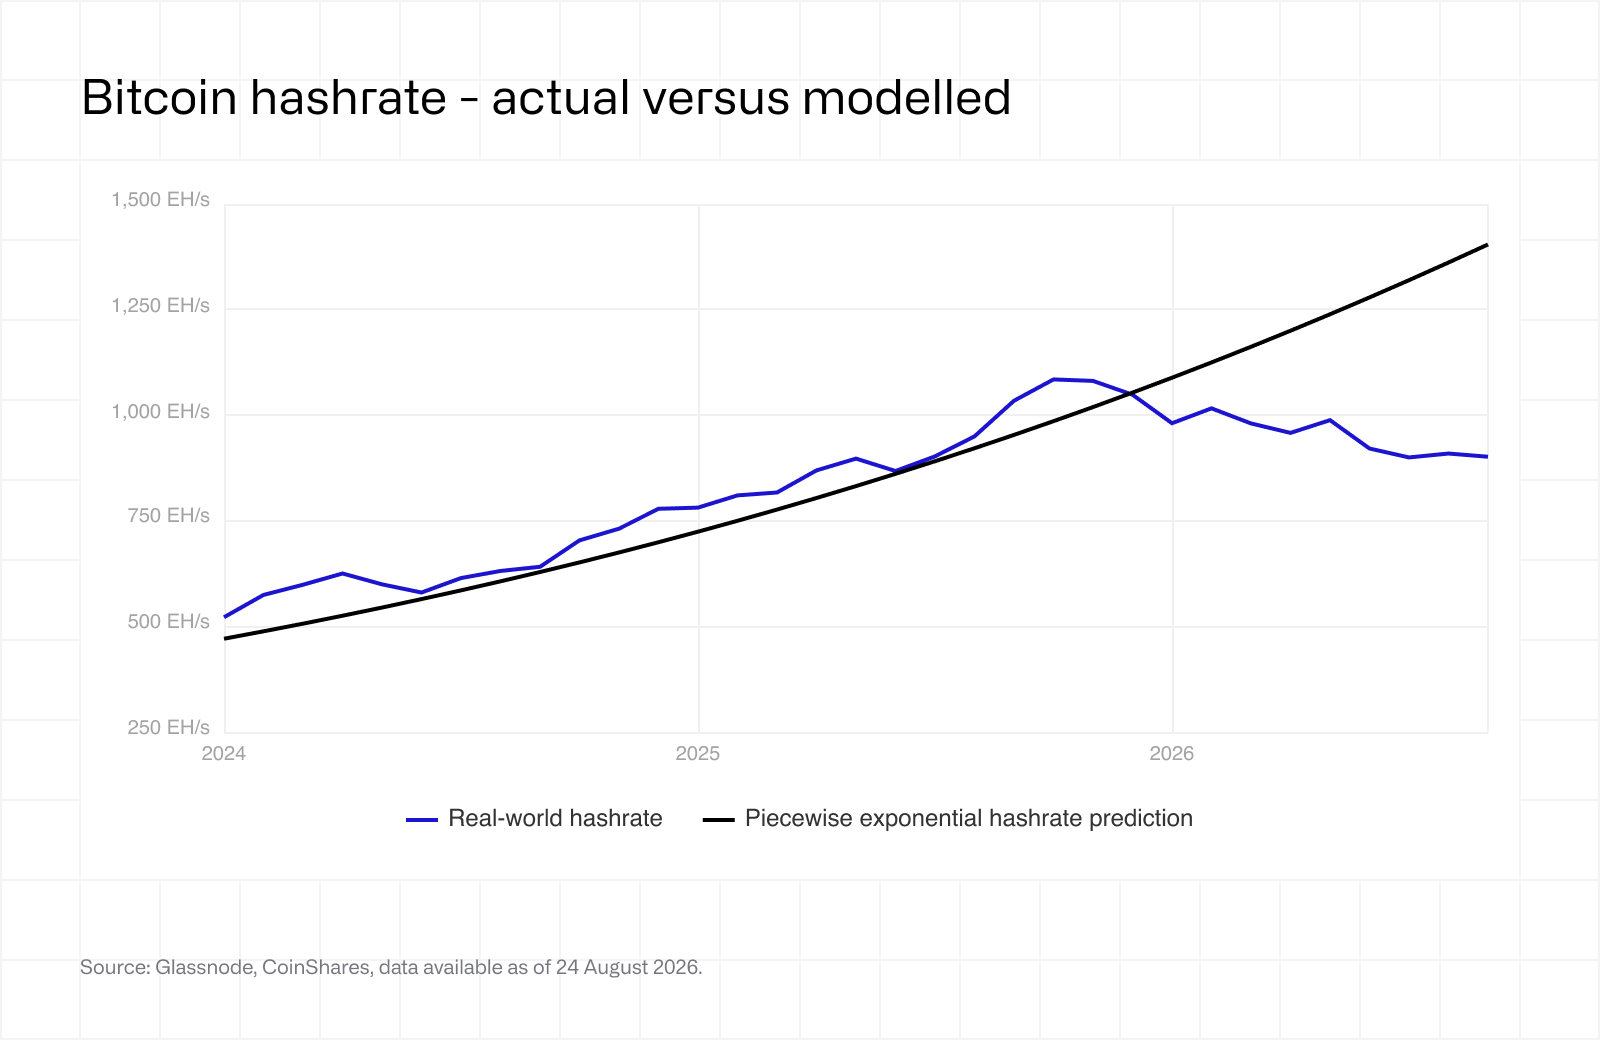
Bitcoin's mining network has just come through its most testing period since the April 2024 halving. From a peak of approximately 1,160 EH/s in early October 2025, the hashrate fell to 850 EH/s by early February 2026, a peak to trough decline of approximately 27%, and the first half of 2026 was the first six-month decline since the China ban in H1 2021. Hash price, the revenue a miner earns per unit of computing power, fell to record lows, spending much of the first half at or below breakeven for a large portion of the fleet. Taken at face value these figures look ominous. Set against the historical record, however, they describe a familiar phase of the mining cycle rather than a structural break.
The most effective way to assess where the hashrate is heading is to analyse historical patterns. Qualitative reasoning suggests growth is partly driven by Bitcoin's price, since a positive outlook encourages miners to add capacity in the expectation of profitability, but this rests on assumptions about future prices. Given the volatility of the hashrate, measuring its deviation from trend yields more accurate results than qualitative judgement alone; we have explored this in earlier work here. We have previously used an out-of-sample trend line but instead have chosen to use our more recent piecewise model approach, which we discuss in detail here, as an historical trendline to ascertain this deviation.
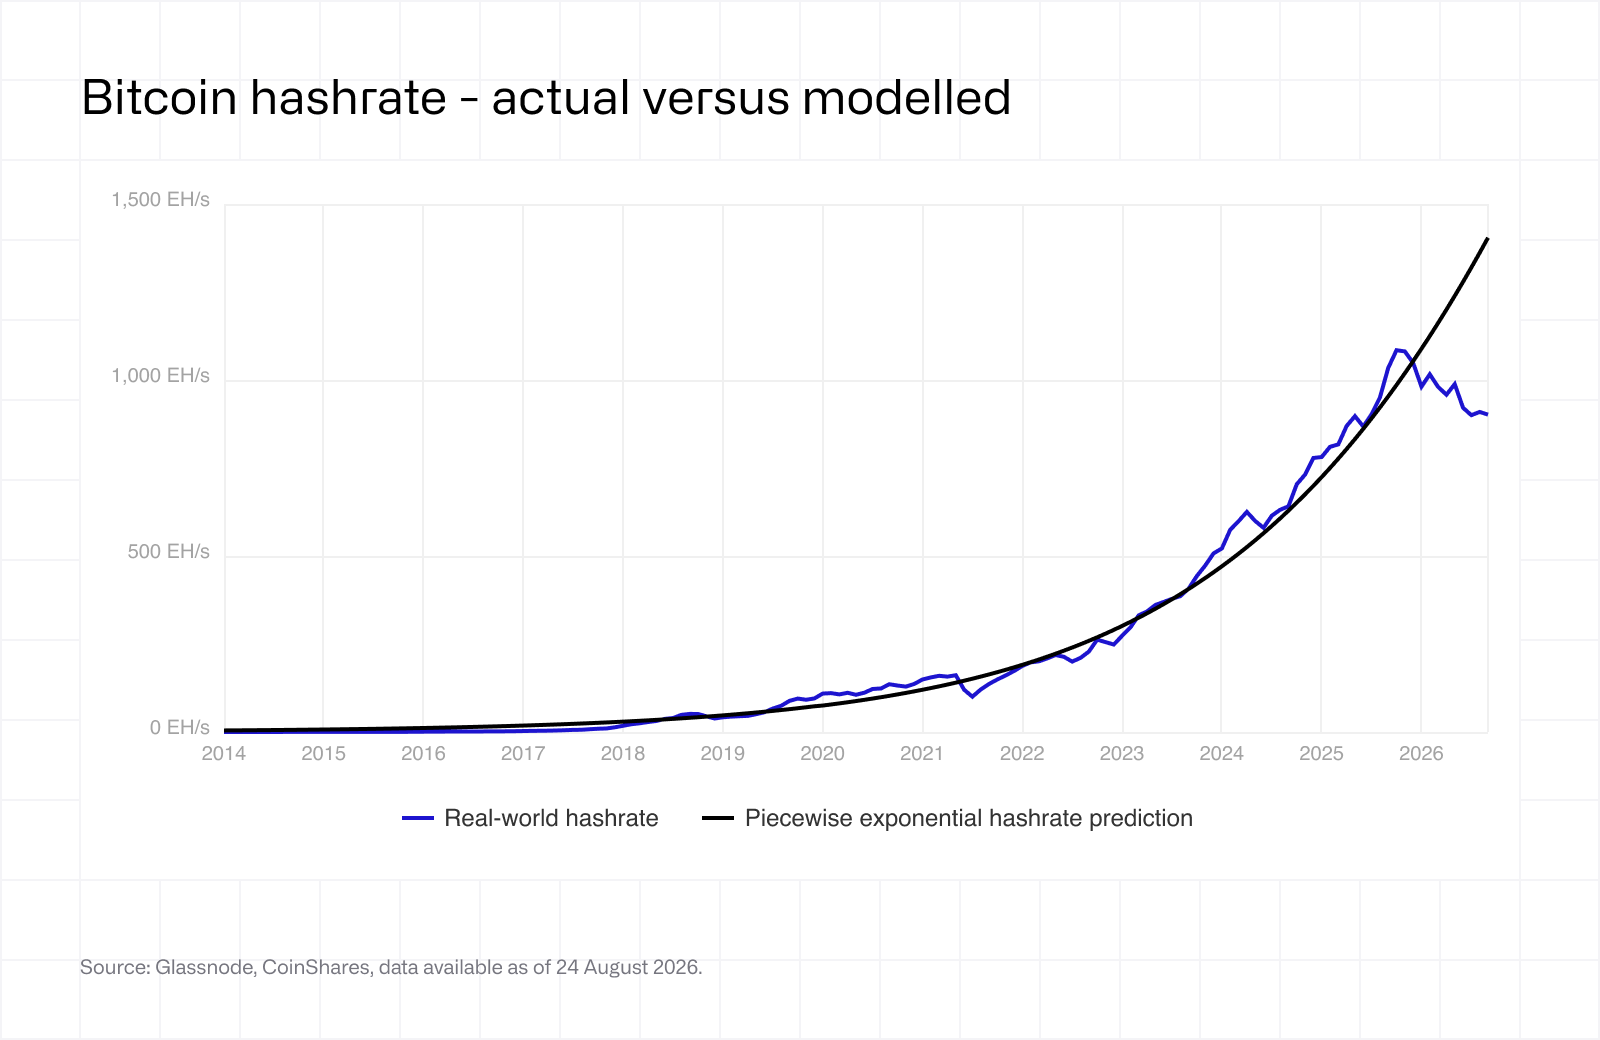
This framework reveals a strikingly regular pattern between halving cycles. Across the 2012, 2016 and 2020 halvings, the hashrate typically fell to around 50% below the trend line in the six months following each event. The China ban in 2021 was particularly sharp due to the abrupt nature of it. We would note this figure is revised from the 42% we published in our January 2024 report, reflecting the subsequent recalibration of our trend line under the piecewise exponential methodology, which alters the measured size of historical deviations. The broader shape is consistent: an initial decline, a recovery midway through the cycle, and a surge in activity roughly a year before the next halving. The logic is straightforward. Miners raise capital expenditure ahead of each halving to remain competitive, driving the hashrate well above trend, while the reduced block reward that follows curtails income and, with it, subsequent investment.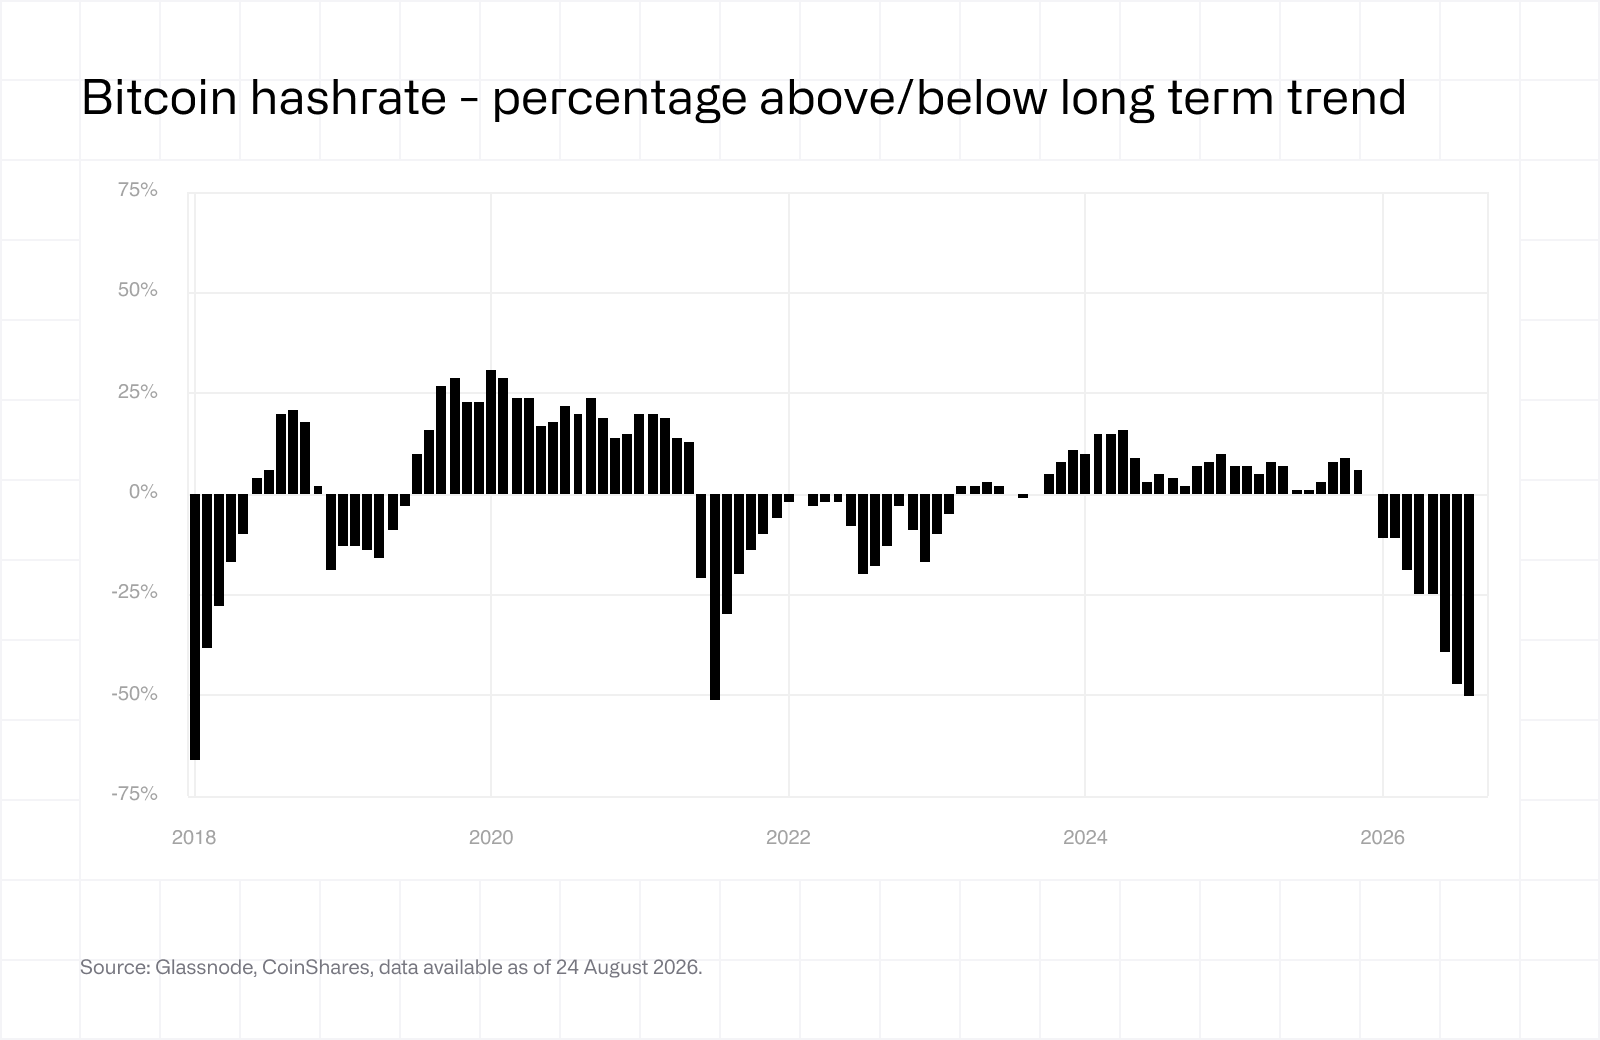
The result is a shortfall of comparable depth to prior cycles, with the hashrate now sitting around 50% below trend, approaching the trough that followed China's ban on the recalibrated trend line, although the decline has unfolded more gradually. This time we believe the cause lies in the sharp rise in Texas power prices at the beginning of the year, coupled with the ongoing transition of miners towards high-powered AI compute. Whether the decline continues will depend partly on the bitcoin price. At present, AI is a far more financially attractive proposition for miners, generating annualised profits of approximately US$1.5m per MW on our estimates, compared with just US$0.5m for mining. A sustained rise in the bitcoin price could alter this calculus dramatically, however, and prompt some miners to recommit capacity to mining.
The current cycle has followed the same rhythm, albeit on a delayed schedule. Rather than dipping immediately after the April 2024 halving, the network continued expanding, surpassing 1 ZH/s for the first time in late August 2025 and peaking in early October, having added roughly 300 EH/s during 2025. The reversal came in the fourth quarter, with the hashrate declining around 10% from the October peak to approximately 1,045 EH/s by late December, then to 850 EH/s by early February before recovering, accompanied by three consecutive negative difficulty adjustments, the first such streak since July 2022. The decline reflected a Bitcoin price correction that pushed legacy S19-era hardware below breakeven, with the breakeven electricity price for the S19 XP falling from approximately US$0.12/kWh in December 2024 to US$0.077/kWh a year later, compounded by rising winter energy costs and ERCOT curtailment through November and December, and renewed regulatory inspections in Xinjiang that curtailed operations without permanently displacing capacity.
The weakness extended into 2026. The network's 30 day average hashrate fell 5.8% quarter on quarter in the first quarter, the sharpest contraction in several quarters, with an estimated 252 EH/s of capacity going offline as older machines became unprofitable. By 13th July the hashrate had fallen 17.5% from its 1st January level of 1,066 EH/s to 879 EH/s; the closest precedent was the first half of 2021, when China's ban drove a 25.9% decline. Capitulation has extended to the corporate level, with TeraWulf, one of the largest listed operators, running down its fleet as buildings convert to HPC. The network has since stabilised, with the seven day average at around 920 EH/s in mid August and difficulty at 127.48T following a 0.99% upward adjustment on 8th August, approximately 18% below the record 155.97T set on 29th October 2025.
Hash price tells the same story in revenue terms and explains why capacity has come offline. From approximately US$63 per PH/s/day at its July 2025 peak, hash price declined steadily through the fourth quarter to a then five year low of US$35 to US$37 by November, and a brief recovery to US$38 to US$40 around the turn of the year proved short lived, with the metric collapsing to fresh lows in the first quarter. Monthly averages set successive all-time records in February and March, at US$32.31 and US$31.27 respectively, before ending June at US$27.7. The compression reflected the convergence of a Bitcoin price that at the time stood at roughly half its October 2025 all time high, transaction fees persistently below 1% of block rewards, and a difficulty level that remained elevated relative to revenue despite recent declines. Hash price has since recovered to around US$38 per PH/s/day as Bitcoin rebounded to approximately US$77,000, lifting most operators back above cash breakeven.
Alarming as these moves may appear, the deviation from trend framework places them firmly within historical experience. On the recalibrated trend line, the current deviation of around 50% below trend is in line with the typical post-halving trough and remains shallower than the China ban episode, while the peak to trough decline of approximately 27% compares with 25.9% in H1 2021. Viewed on a log scale it is considerably less severe than that episode. The mechanism differs, economic capitulation rather than regulatory shock, but the sequence of an extended run above trend, a reversion below it, miner capitulation at the trough and a subsequent recovery is precisely what prior cycles would predict. The sharp bounce from the February low indicates that many operators continue to view mining as economically viable, and if the historical template holds, the network should enter its next expansion phase as the 2028 halving approaches, with the characteristic pre-halving surge beginning roughly a year beforehand.
Our piecewise prediction model had pointed to the network reaching 1.8 ZH/s by the end of 2026 and 2 ZH/s by the end of March 2027. The first half contraction has left the hashrate well below that path, and these milestones now look likely to arrive materially later than originally forecast. The geography of mining continues to shift meanwhile: the top three countries, the United States, China and Russia, control approximately 68% of global hashrate, with the United States gaining around two percentage points of share quarter on quarter, while emerging markets including Paraguay, Ethiopia and Oman have entered the global top ten, driven by operators such as HIVE, with 300MW in Paraguay, and Bitdeer, with 40MW in Ethiopia.
5. Cost to mine analysis
5.1 Overview
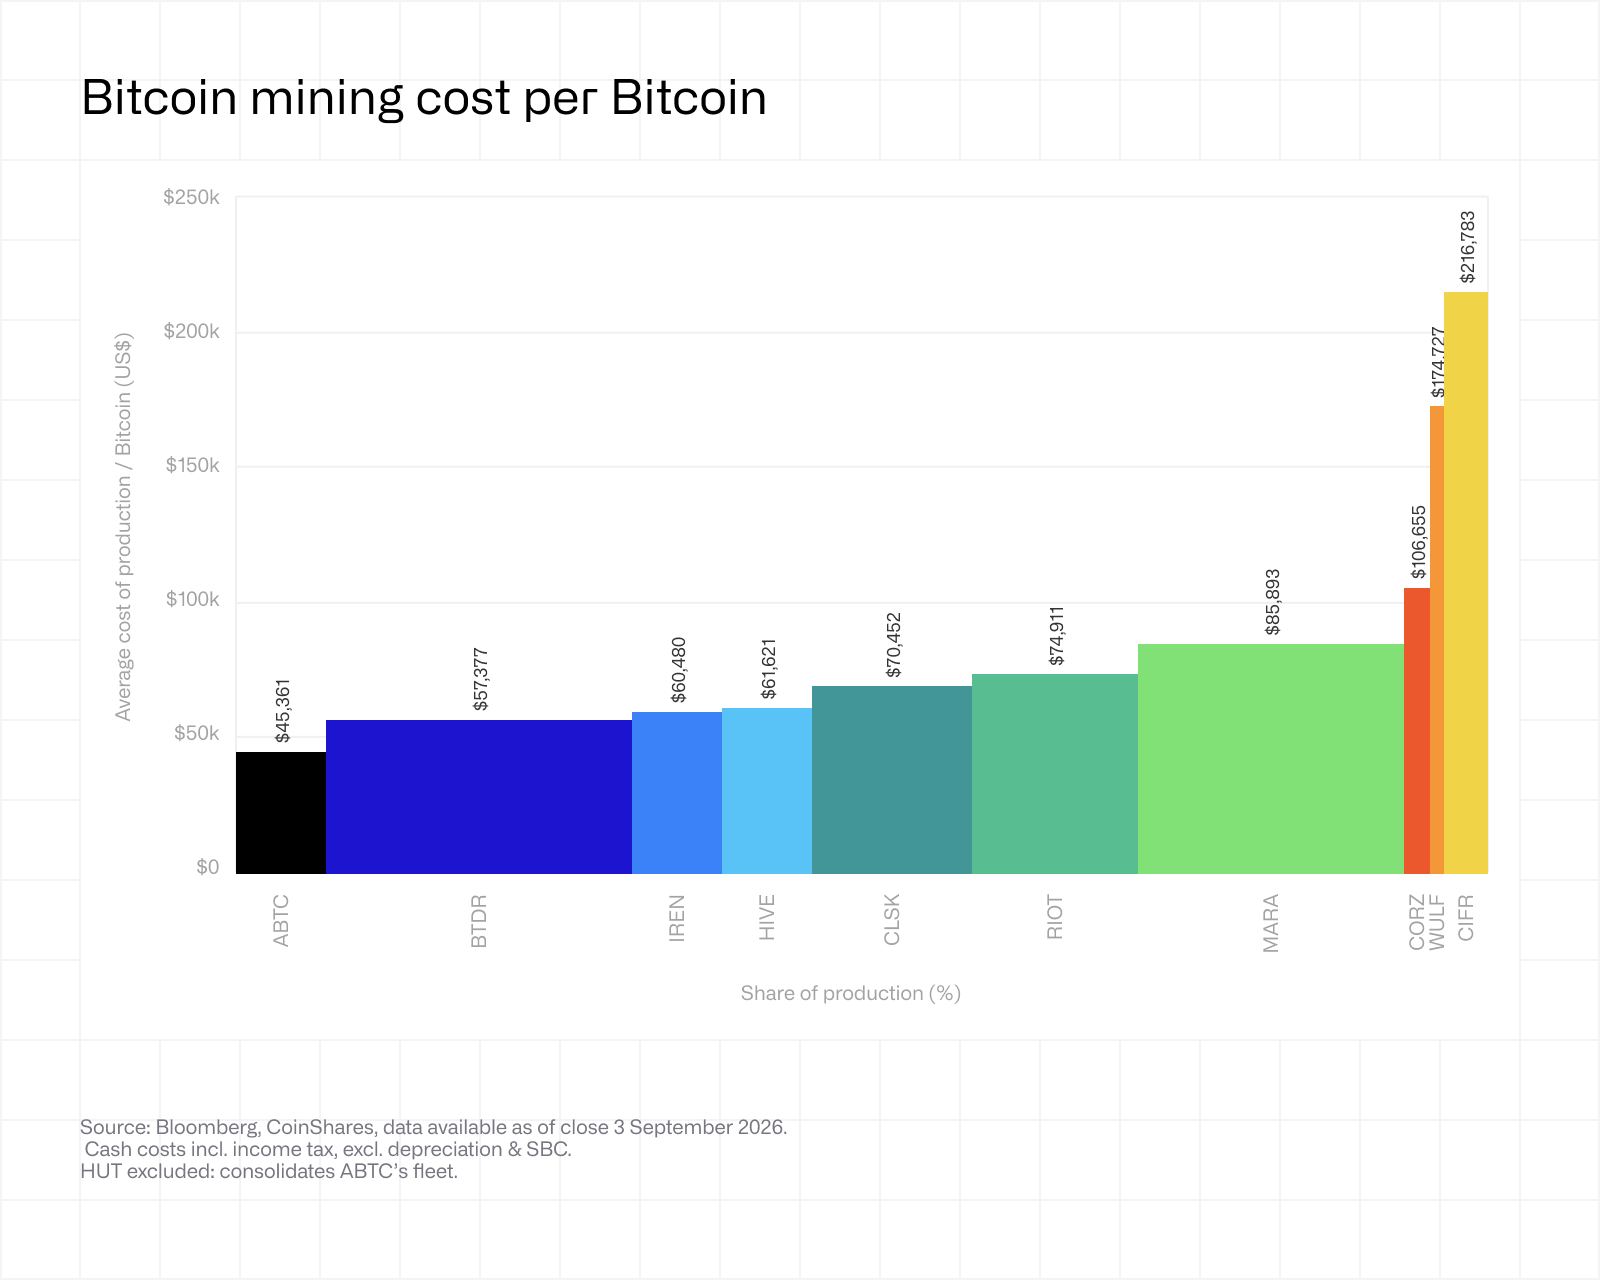
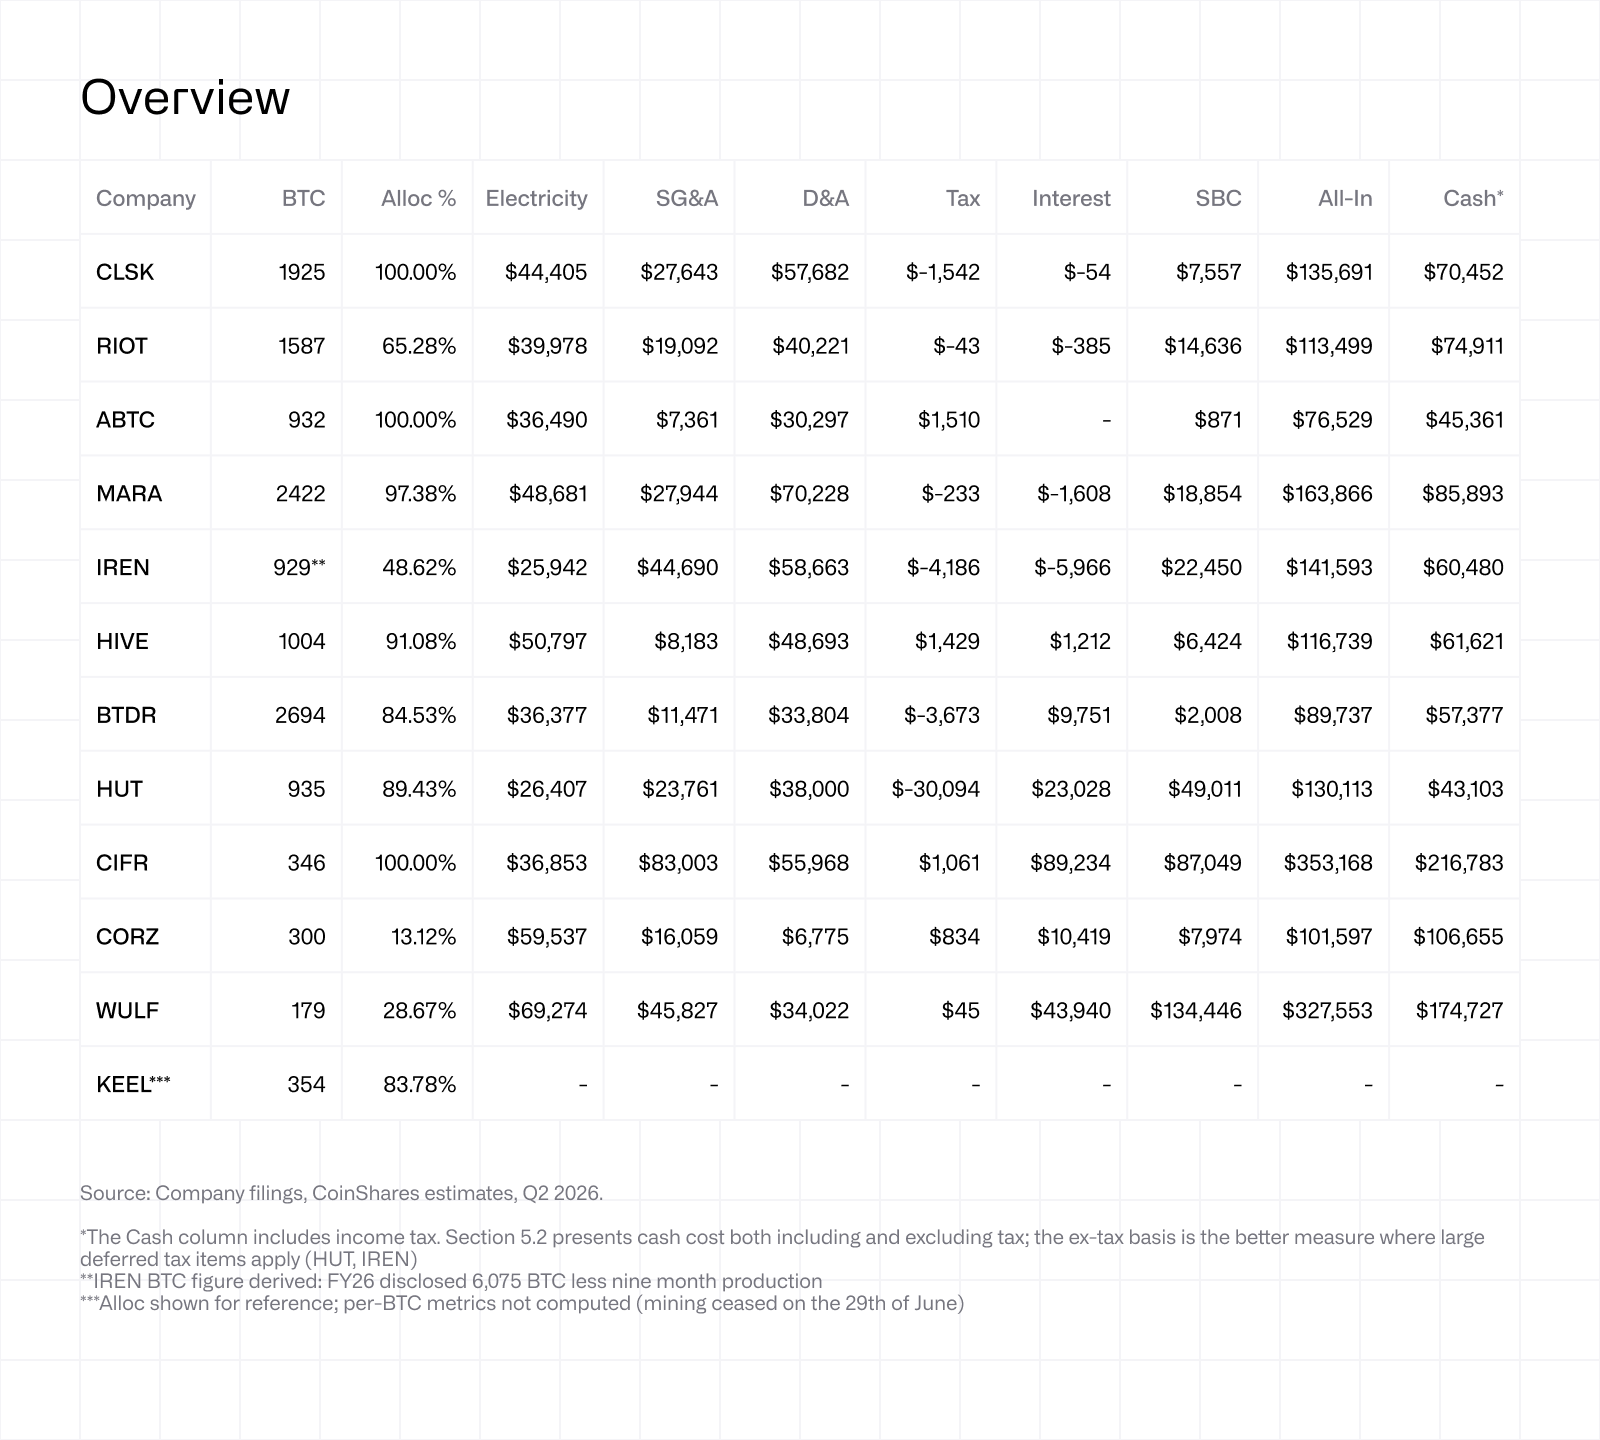
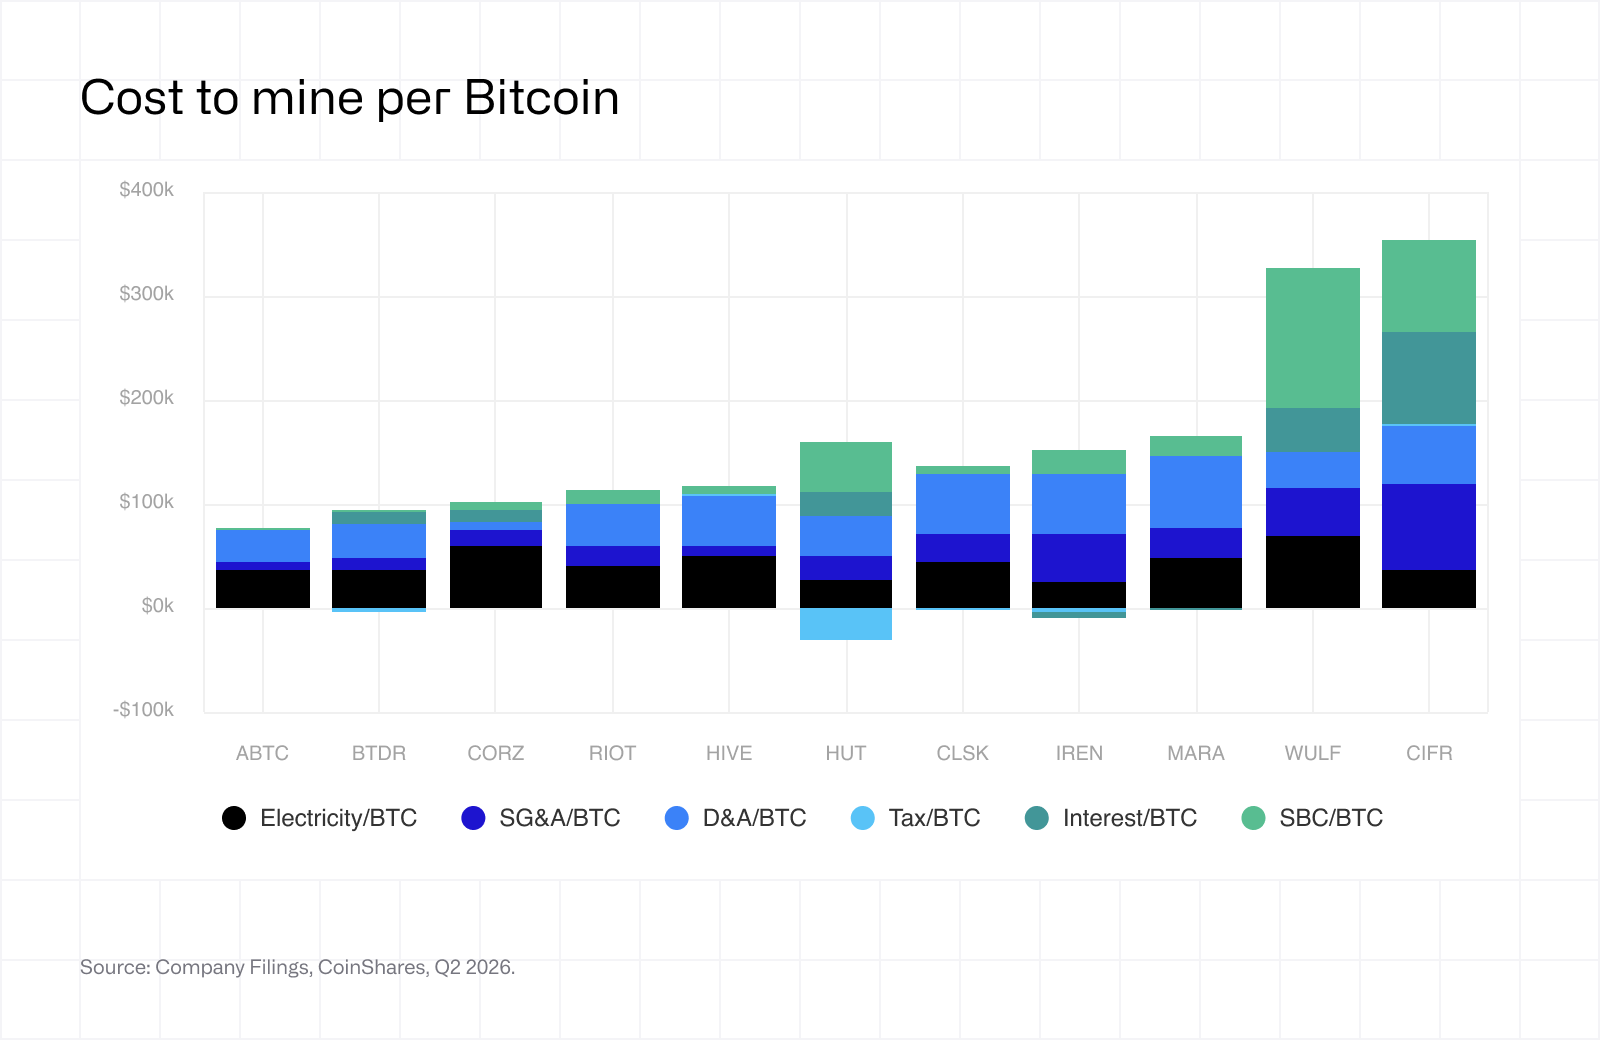
The table below presents the Q2 2026 cost-per-BTC breakdown for all covered miners. All figures are in USD per BTC mined, with costs allocated to self-mining using the revenue share methodology described in the Appendix.
Key Observations:
Cash profitability varied widely. ABTC, BTDR, HIVE and IREN mined below realised prices, while CLSK and RIOT were around breakeven. MARA recorded a cash loss of approximately US$15,800/BTC, while the exiters higher costs largely reflect falling production.
Self mining allocation increasingly contributes to all-in costs. Mining represented 48.6% of revenue at IREN and 13.1% at CORZ, meaning most corporate costs were allocated elsewhere. Electricity generally provides the cleanest operational comparison, except at WULF where the disclosed line does in fact blend mining and HPC costs.
Tax materially distorts HUT’s figures. A US$28.1m deferred tax benefit reduces cash cost including tax to US$43,103/BTC, compared with US$73,197/BTC ex-tax. The ex-tax figure provides a better measure of mining breakeven.
SBC remains a major differentiator. It ranged from US$871/BTC at ABTC to US$134,446/BTC at WULF, exceeding electricity costs at HUT, CIFR and WULF. WULF’s figure reflects a 28.7% allocation of US$83.9m in grants across only 179 BTC (reflecting the shrinking production base as the company moves away from Bitcoin mining ).
5.2 Company-by-Company Breakdown
CLSK CleanSpark Inc
BTC mined: 1,925
All-in cost: $135,691/BTC
Cash cost: $70,452/BTC
Cash cost (ex-tax): $71,995/BTC
*CleanSpark's June quarter is Q3 FY2026 because it has a September year-end.
The company produced 1,925 BTC with a 100.00% allocation ratio: its $138.0M of mining revenue was its sole revenue, with no hosting or HPC revenue recorded. This makes CLSK the cleanest pure-play within the report.
Electricity was $44,405/BTC, while the $71,995/BTC cash cost almost exactly matched realised revenue of $71,691/BTC. D&A remained the largest bucket at $57,682/BTC, followed by SG&A at $27,643/BTC.
SBC was still relatively contained at $7,557/BTC, although the underlying quarterly charge tripled YoY to $14.5M per company disclosure. CleanSpark also signed its first HPC lease during the quarter, a 20-year agreement at Sandersville with a $6.6B base-term value. HPC contributed $0.0M of revenue in Q3 FY2026, but the agreement means that CleanSpark will no longer be a pure-play going forward.
RIOT Riot Platforms Inc
BTC mined: 1,587
All-in cost: $113,499/BTC
Cash cost: $74,911/BTC
Cash cost (ex-tax): $74,955/BTC
Riot's $39,978/BTC electricity cost, net of ERCOT demand-response credits, makes the $113,499/BTC all-in figure competitive.
Cash cost of $74,955/BTC was marginally above realised revenue of $71,667/BTC, putting the company slightly above full-cash breakeven. Its own direct cost to mine of $49,912/BTC corresponds closely to our electricity plus non-power direct costs; the extra gap comes from the rest of the business operations. Mining supplied 65.28% of $174.2M total revenue, so roughly one-third of the figures do not apply to the 1,587 BTC produced.
The $28.0M impairment of Rockdale repurposing from mining to data centres was excluded from the cost analysis. Riot's transition now includes a 191MW, 20-year frontier AI lease worth approximately $9.1B, alongside guided deployment capex of $2.1B to $2.3B.
ABTC American Bitcoin Corp
BTC mined: 932
All-in cost: $76,529/BTC
Cash cost: $45,361/BTC
Cash cost (ex-tax): $43,851/BTC
ABTC was the cheapest producer in the table, with an all-in cost of $76,529/BTC and cash cost of $43,851/BTC against realised revenue of $71,905/BTC. Electricity of $36,490/BTC was the $34.0M hosting fee paid under its fixed arrangement with 80% parent Hut 8, rather than the underlying cost of actually powering the fleet.
Hut 8's consolidated accounts put the direct cost of the same fleet at no more than $24.7M, including approximately $22.8M of ASIC-only cost based on its disclosed 66% ASIC Compute gross margin. The difference is roughly $11.0M per quarter, or approximately $12,000/BTC, extracted by the parent through the related-party hosting price. ABTC minority shareholders bear that transfer price in full, while it eliminates in Hut 8's consolidated accounts. SG&A of $7,361/BTC and SBC of $871/BTC were the lowest in the table, while reported income-tax expense added $1,510/BTC to all-in cost.
MARA MARA Holdings Inc
BTC mined: 2,422
All-in cost: $163,866/BTC
Cash cost: $85,893/BTC
Cash cost (ex-tax): $86,126/BTC
MARA mined 2,422 BTC, but the cash cost of $86,126/BTC exceeded its $70,315/BTC realised revenue by approximately $15,800/BTC. The company was therefore mining at a full-cash loss at a large scale. Electricity was $48,681/BTC, with $69.2M of its $117.9M power bill paid to third-party hosting providers. Full cost of revenues contained another $26.9M, or approximately $11,000/BTC, of non-power direct costs into the cash calculation.
D&A of $70,228/BTC was the largest all-in contribution and included $28.1M of accelerated depreciation. SG&A added $27,944/BTC and SBC a further $18,854/BTC. These costs took all-in costs to $163,866/BTC.
The quarter also resolved MARA's tax distortion. A $587.2M valuation allowance removed deferred tax benefits generated by fair-value accounting for its BTC holdings, leaving only a $233/BTC tax benefit in the cost calculations. MARA's policy authorises sales from its full 53,822 BTC reserve, while the 64% Exaion acquisition cost $174.5M and its Starwood venture is targeting two data-centre leases by year-end. Neither generated significant revenue in the quarter.
IREN Iren Ltd
BTC mined: 929
All-in cost: $141,593/BTC
Cash cost: $60,480/BTC
Cash cost (ex-tax): $64,667/BTC
*IREN's June quarter is Q4 FY2026 because it has a June year-end
The company's $25,942/BTC electricity cost was the lowest among the listed miners, and cash cost of $64,667/BTC remained below realised revenue of $71,798/BTC. The main cost pressure came from the AI platform being built amid a shrinking bitcoin production operation.
AI Cloud revenue reached $70.5M and overtook mining revenue of $66.7M for the first time, representing 51.4% of total revenue. FY26 SG&A tripled YoY to $128.3M per company disclosure as headcount roughly tripled, five C-suite appointments were made and the Mirantis and Nostrum acquisitions closed. Even after allocation, SG&A contributed $44,690/BTC, while SBC added $22,450/BTC and D&A $58,663/BTC. Net interest income reduced cost by $5,966/BTC, supported by $35.9M earned on a $7.6B cash balance against $24.5M of finance expense.
The 10-K states the transition from bitcoin mining will substantially complete by December 31, 2026, making this likely IREN's final full quarter as a bitcoin miner. The $450.4M mining-hardware impairment, $102.1M markdown on rigs held for sale, $25.1M of disposal losses and $9.6M of other operating expenses were excluded from the cost analysis.
HIVE HIVE Digital Technologies Ltd
BTC mined: 1,004
All-in cost: $116,739/BTC
Cash cost: $61,621/BTC
Cash cost (ex-tax): $60,192/BTC
*HIVE's June quarter is Q1 FY2027 because it has a March year-end.
Production rose 147% YoY to 1,004 BTC per company disclosure as its Paraguay sites scaled, with average hashrate reaching 24.0 EH/s. Cash cost of $60,192/BTC remained below realised revenue of $71,773/BTC, leaving a decent cash margin despite electricity cost of $50,797/BTC.
D&A was the largest cost contribution at $48,693/BTC, reflecting the company's accelerated ASIC depreciation schedules. SG&A remained low at $8,183/BTC and interest was $1,212/BTC. HIVE sold 918 of the 1,004 BTC mined and transferred another 46 BTC to Bitmain equipment deposits with repurchase options struck at $110,000, while ending the quarter with 190 BTC. It also raised approximately $276.0M during the quarter, increasing cash from $23.1M to $208.0M.
The $84.65M Swedish VAT provision following adverse Court of Appeal judgments was excluded from the cost analysis. A further $10.9M Boden loan is contingent on a favourable ruling and a related $1.8M receivable was impaired. These legal and depreciation effects are large accounting buckets, but the $60,192/BTC ex-tax cash figure shows that the expanding mining operation remains fairly profitable compared to the quarter’s realized revenue.
BTDR Bitdeer Technologies Group
BTC mined: 2,694
All-in cost: $89,737/BTC
Cash cost: $57,377/BTC
Cash cost (ex-tax): $61,051/BTC
Bitdeer was the largest producer in the table at 2,694 BTC, up 61% QoQ, and recorded the second-lowest all-in cost of $89,737/BTC. Electricity was $36,377/BTC across self-mining and co-mining, supported by an efficient 15.8 J/TH fleet and $44/MWh average power cost. Cash cost of $61,051/BTC remained comfortably below realised revenue of $71,789/BTC.
The quarter’s results support the case for expending large costs for their vertically integrated SEALMINER model, but there are two accounting caveats that should be noted. The company moved from IFRS to US GAAP on January 1, 2026, with prior periods recast. It also expensed $36.1M of R&D, principally chip development, which was excluded from the cost analysis under our typical report methodology. Allocating that spend would add approximately $11,300/BTC.
Interest of $9,751/BTC was the highest among the significant miners in the table, reflecting $1.8B of borrowings used to fund the Tydal build-out. Bitdeer also raised $463.8M through its ATM during Q2.
HUT Hut 8 Corp
BTC mined: 935
All-in cost: $130,113/BTC
Cash cost: $43,103/BTC
Cash cost (ex-tax): $73,197/BTC
*Hut 8 provides the consolidated view of ABTC's fleet.
ABTC pays Hut 8 $34.0M to host its fleet. In Hut 8's own accounts, that fee has now disappeared and what is left is the actual cost of running the machines: as per its disclosures this is no more than $24.7M. The roughly $11.0M difference is margin Hut 8 earns from its own subsidiary. ABTC's minority shareholders pay for this; Hut 8's shareholders technically get it back through consolidation.
On costs, the ex-tax figure is the one that should be used for comparison. The headline $43,103/BTC cash cost is softened by a $28.1M deferred tax benefit worth $30,094/BTC, which is not cash received. Once this figure is removed, cash cost is $73,197/BTC, just above the $71,674/BTC each coin realised.
Interest of $23,028/BTC comes from $7.5B of project notes raised to build AI campuses, and SBC of $49,011/BTC from a $51.2M quarterly grant charge, which is a pretty large part of the all-in cost.
CIFR Cipher Digital Inc
BTC mined: 346
All-in cost: $353,168/BTC
Cash cost: $216,783/BTC
Cash cost (ex-tax): $215,723/BTC
Cipher's $353,168/BTC all-in cost is misleading as it largely reflects the company's transition into AI. Even though mining supplied 100.00% of reported revenue in the quarter, the corporate cost of a 5.3GW infrastructure portfolio was allocated across only 346 BTC. SG&A contributed $83,003/BTC, interest $89,234/BTC and SBC $87,049/BTC. Odessa's fixed power agreement at approximately 2.8 cents/kWh, together with $2.3M of curtailment and power-sale credits, kept electricity at $36,853/BTC and provided the only rationale to keep the site operational.
H1 P&L interest expense of $125.9M exactly matched an amortisation of debt discount on $1.3B of 0% 2031 convertible notes, while $23.2M of construction interest was capitalised and H1 cash interest paid was $63.9M. Overall, it should be clear that the per-BTC figures reflect the operational burden of the wider platform and not the Odessa marginal cost of production.
CORZ Core Scientific Inc
BTC mined: 300
All-in cost: $101,597/BTC
Cash cost: $106,655/BTC
Cash cost (ex-tax): $105,821/BTC
Core Scientific is the only company whose cash cost ($105,821/BTC) is higher than its all-in ($101,597/BTC). Cash cost includes everything it spends to run the mining operation: power, plus roughly $19,800/BTC of staff and site costs. All-in starts from power (only), then adds D&A and SBC, but with mining now just 13.12% of revenue, barely any of those costs get allocated to bitcoin mining.
Core Scientific's own segment disclosure shows $33.7M of self-mining cost of revenues, of which $23.8M was cash (the rest depreciation). Spread across the 300 BTC mined, that is roughly $79,300 in direct cash costs with an average realized revenue of $71,783 per BTC, consistent with the disclosed gross margin of negative 56%. Around 30% fewer miners were online than at the end of Q1 per company disclosure, with the remaining fleet running purely to absorb contractual power obligations during conversion.
WULF TeraWulf Inc
BTC mined: 179
All-in cost: $327,553/BTC
Cash cost: $174,727/BTC
Cash cost (ex-tax): $174,683/BTCTeraWulf disclosed its 179 BTC production only in the 10-Q. HPC lease revenue was $31.9M, or 71% of $44.8M total revenue, leaving a 28.67% bitcoin mining allocation. The $327,553/BTC all-in cost and $174,683/BTC cash cost mean TeraWulf cannot be compared on unit economics: it is switching off mining while the AI business overshadows the cost base.
Even the electricity cost of $69,274/BTC is overstated because the underlying cost-of-revenues line, stated net of $2.8M in demand-response credits, blends mining power with HPC tenant power passed through at cost. SBC of $134,446/BTC is notably large: it spreads the 28.67% mining share of $83.9M in group grants across a very small production of coins, and is therefore not an accurate reflection of its mining cost. Interest added $43,940/BTC.
KEEL Keel Infrastructure Corp
BTC mined: 354
All-in cost: n/a
Cash cost: n/a
Cash cost (ex-tax): n/a
Mining Ceased 29th June 2026
Keel's row is missing in our table because no Q2 cost-per-BTC figure would be meaningful enough to include. It has been added in the analysis purely because the company produced 354 BTC and it would be prudent to mark the ceasing of its mining operations (29th of June as per company disclosures). Mining did represent 84% of its quarter’s revenue, but it will be 0% in Q3. Keel is officially no longer a bitcoin mining company by all definitions of the phrase.
6. Miner stock performance & valuation
Q2 was a strong re-rating. 10 of the 12 companies covered gained between 70% and 195%, led by Keel at 194.4% despite the company shutting down its mining operations during the quarter. IREN rose 33.4%, while ABTC was the only decliner at -26.3%. Every company except ABTC has also outperformed Bitcoin year to date, with BTC down 10.1%. ABTC remains the outlier at -67.2% YTD as the premium attached to its late-2025 listing continued to unwind.
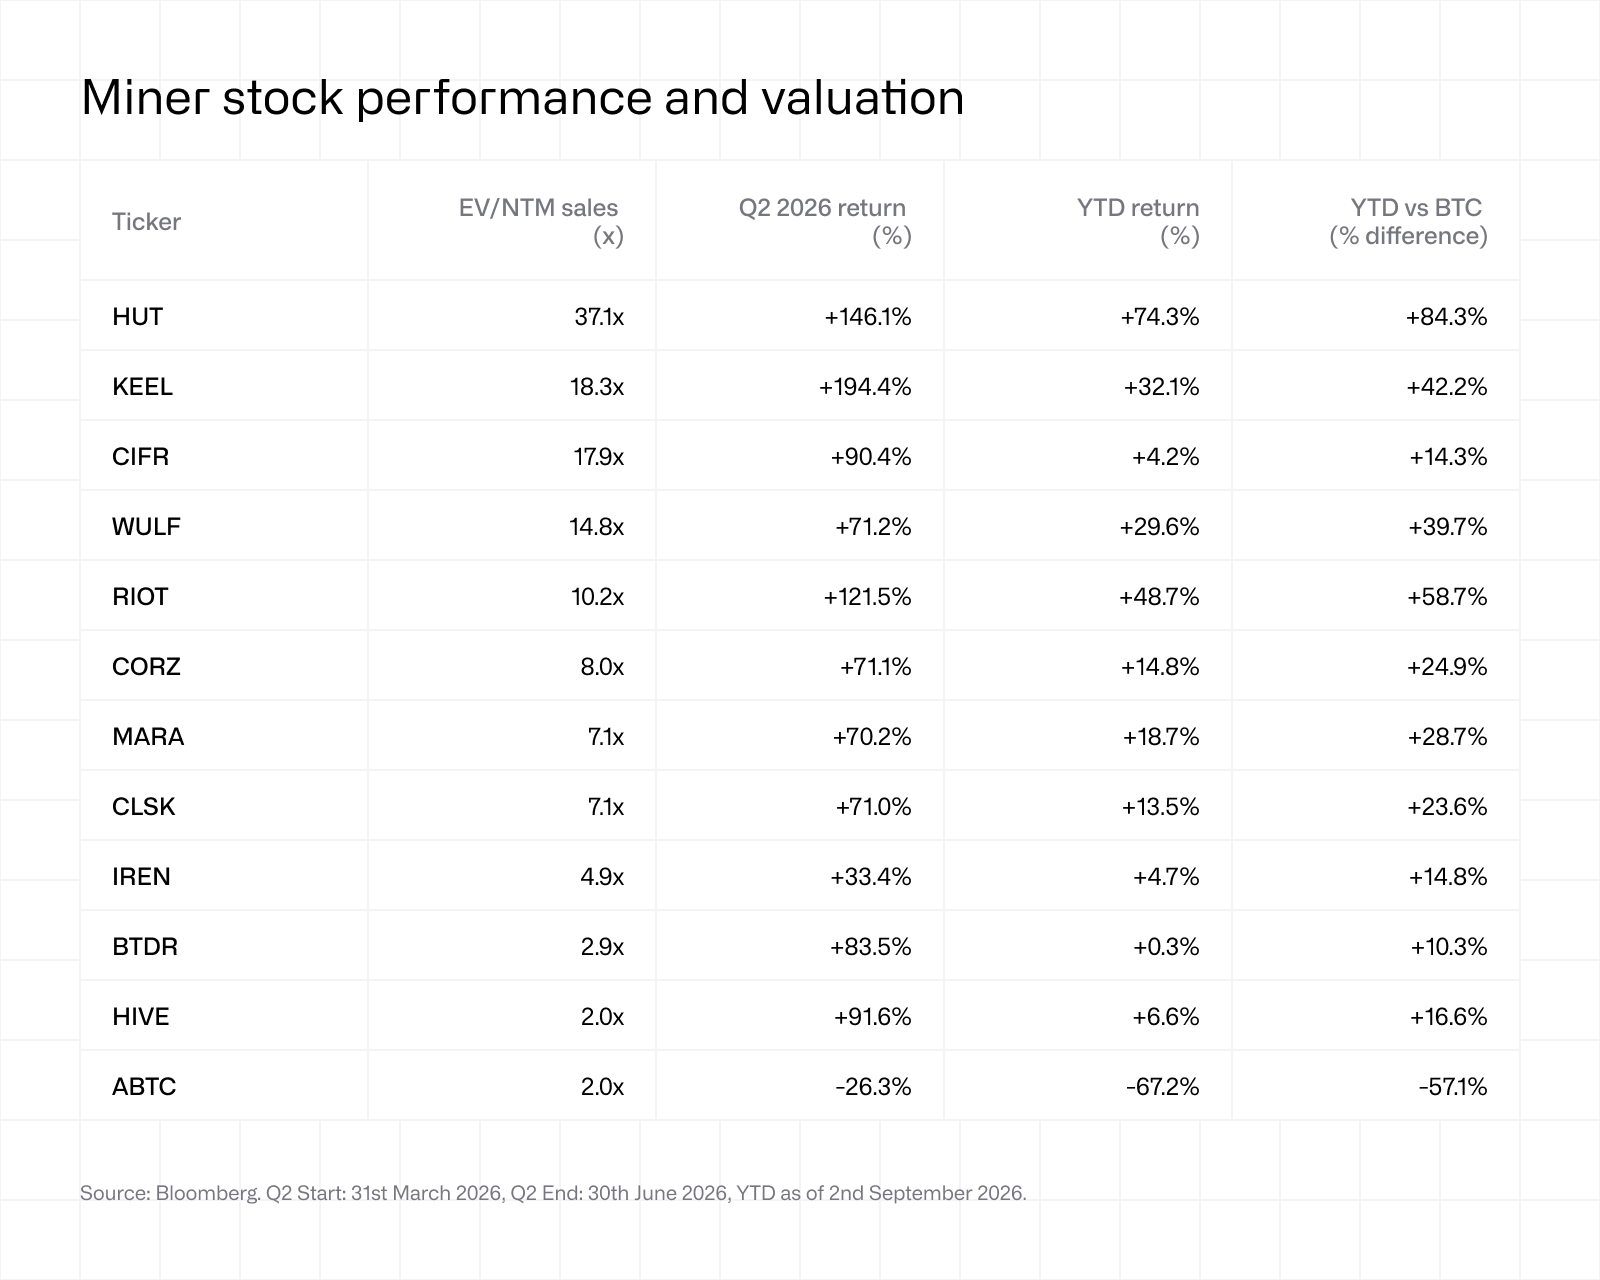
The valuation gap between mining-led and AI-focused companies widened further. HUT, CIFR, WULF and CORZ now average 19.4x EV/NTM sales, compared with 6.6x for MARA, CLSK, RIOT and HIVE. Companies with contracted AI or HPC capacity average 12.9x. Among the continuing miners without contracts, MARA, HIVE and ABTC average 3.7x. Keel is the clear exception, trading at 18.3x despite having no signed tenant.
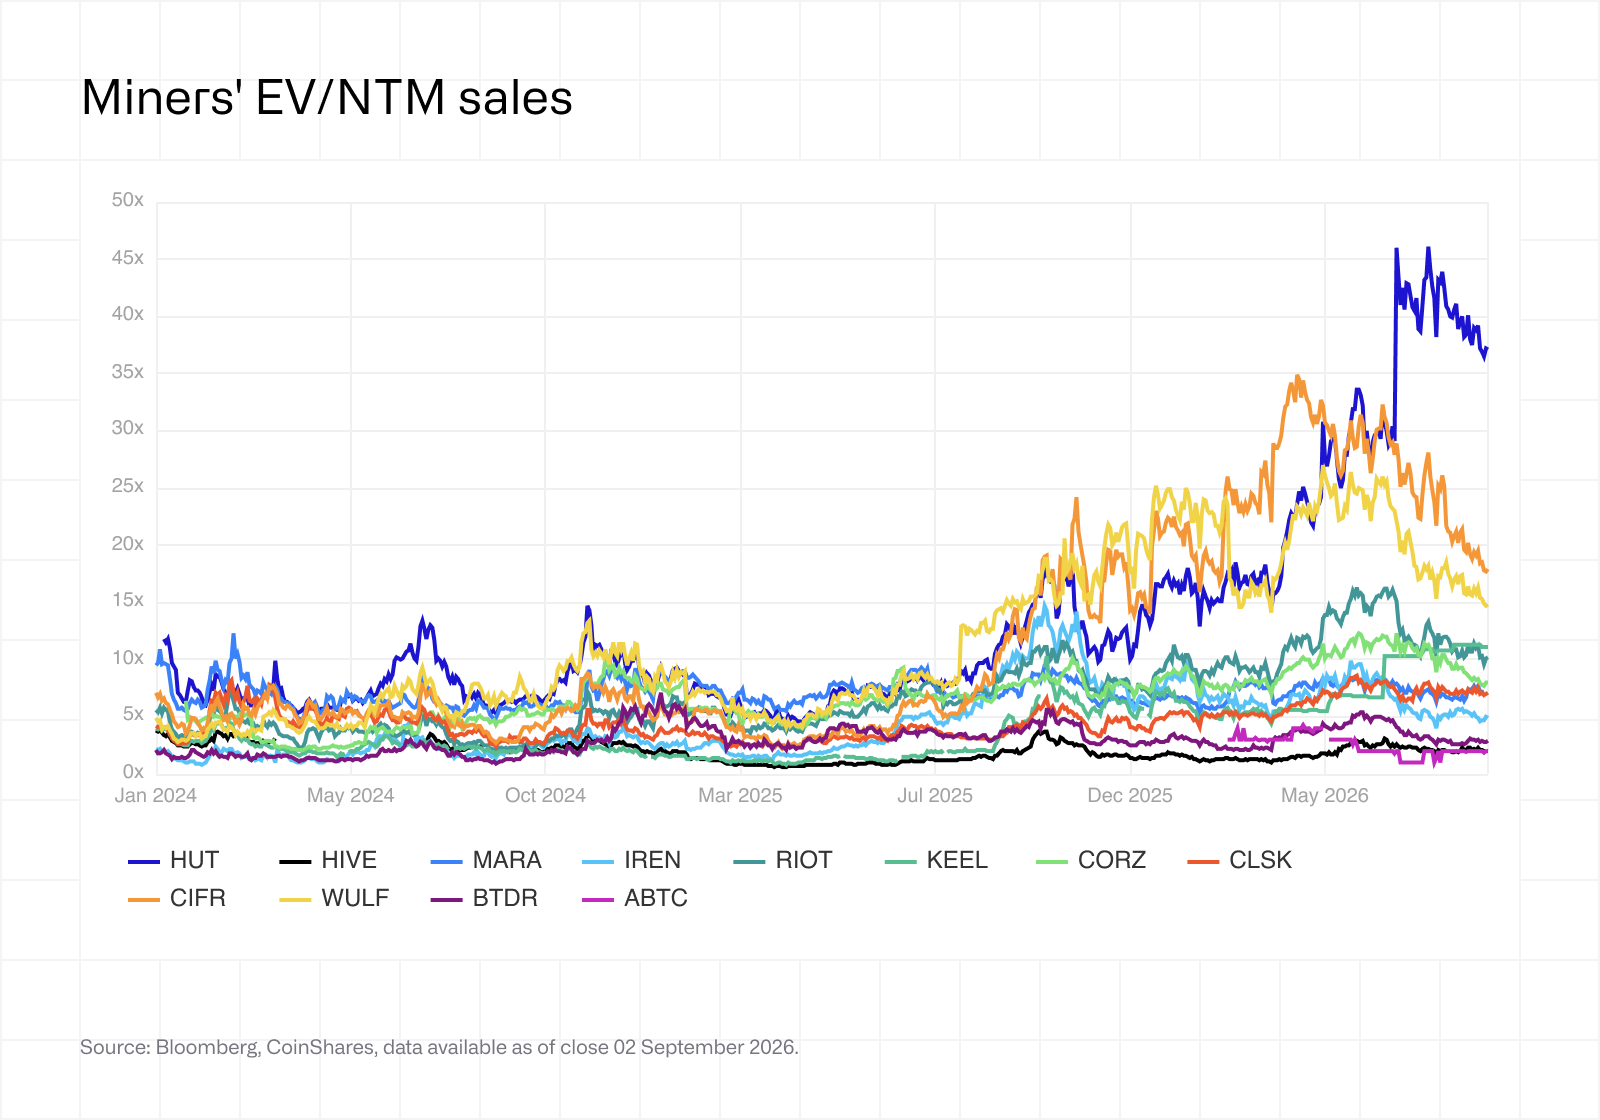
Valuations also vary significantly within the contracted group, from 2.9x at BTDR to 37.1x at HUT. CORZ has one of the sector’s largest backlogs but trades at 8.0x, below RIOT at 10.2x despite Riot’s much smaller contracted book.
The extreme boundaries of the valuations do need some contextualising. HUT’s 37.1x multiple, down from nearly 46x in late July, partly reflects the US$7.5bn of project debt raised in Q2 being included in enterprise value before the actual associated revenue begins. IREN trades at only 4.9x because consensus estimates already include part of its US$4bn ARR target. CIFR provides the clearest example of this effect: its multiple has fallen from around 35x in mid-April to 17.9x, despite its shares gaining 90.4% in Q2, as Black Pearl revenue entered forecasts. As contracted projects move into revenue estimates, multiples can fall even while share prices rise.
More than 4GW of IT capacity is now contracted across the companies covered, but only around 550MW is billing. Disclosed backlogs of more than US$100bn therefore sit against less than US$800m of annualised colocation revenue.
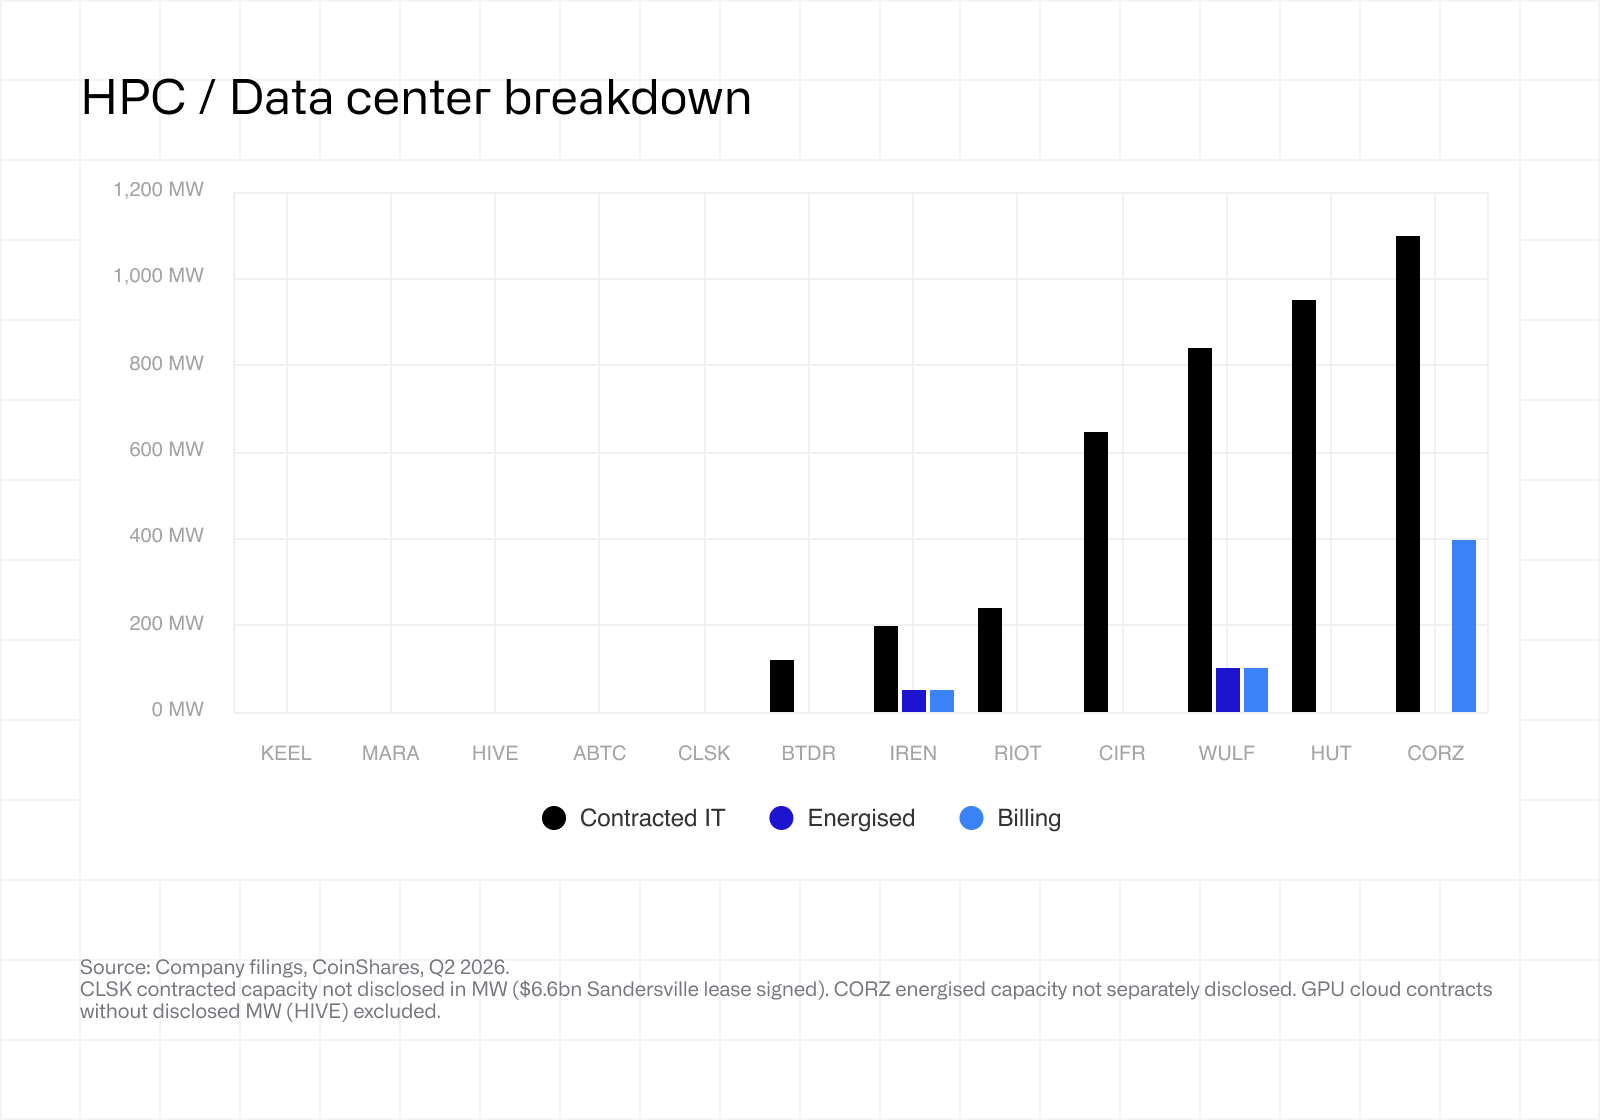
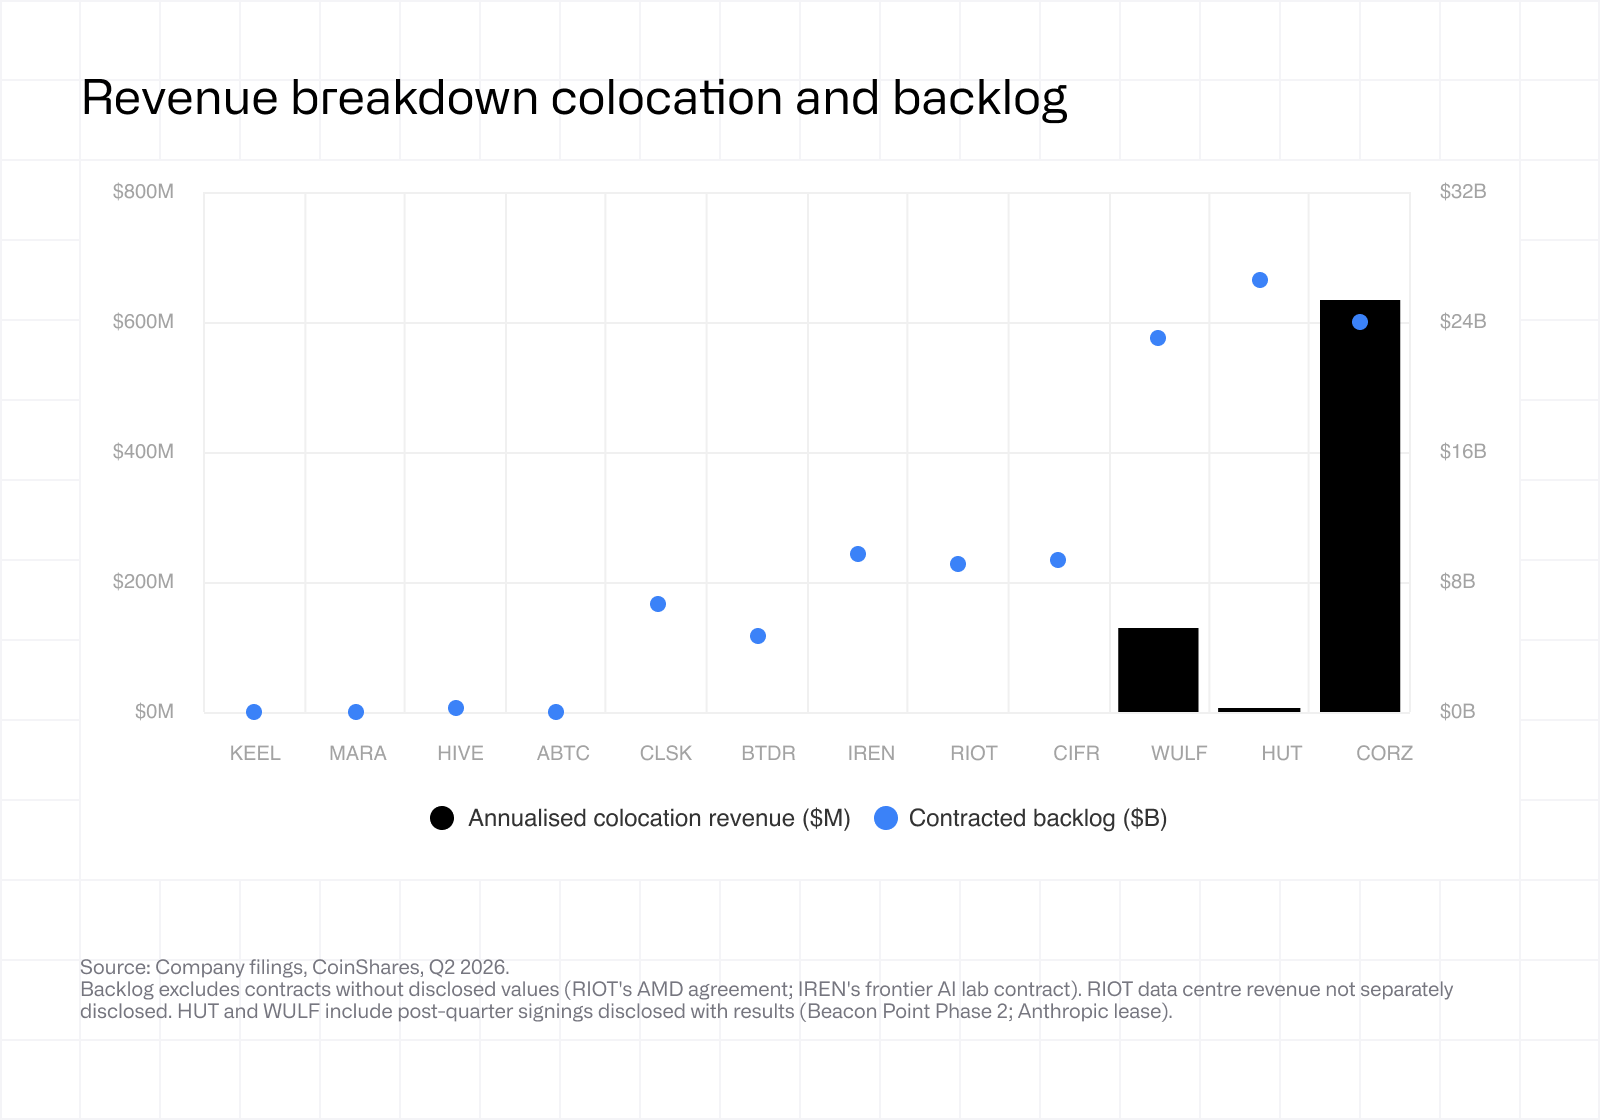
Companies that bring capacity online on schedule should see revenue catch up with valuation, while delays would make the current premiums increasingly difficult to justify.
7. Outlook for Q3 2026 and beyond
At least 35 EH/s is scheduled to leave from the listed miners. Keel has already reached zero, while IREN plans to exit by 31 December 2026 with 23.2 EH/s installed and Cipher is likely to exit by end-2027 with 11.6 EH/s at Odessa. TeraWulf is also winding down its remaining 145MW, although the network impact depends on whether its miners are retired or resold.
A BTC recovery is unlikely to reverse the AI transition. Core Scientific paid US$41.9m to terminate its 15 EH/s Proto agreement, while several companies have committed sites to 15-year leases. Any renewed mining investment is therefore more likely to come from Riot, MARA, HIVE and Bitdeer, which have retained greater flexibility.
A sustained hash-price recovery still depends on BTC. In Q2, at a quarter-end BTC price of US$58,400, only ABTC, BTDR, HIVE and IREN mined below realised prices. BTC's recovery to approximately US$77,000 has since lifted hash price to around US$38/PH/s/day; the question for Q3 is whether BTC holds above US$70,000 for the full quarter, improving economics across the board.
Rig prices are likely to soften. Sub-10 J/TH hardware from Bitmain and Bitdeer is scaling through H2 2026, while 15 EH/s of cancelled Proto capacity may return to the market. This should improve upgrade economics for miners that remain committed.
AI/HPC revenue should accelerate through H2 2026. More than US$100bn of contracts currently supports only around US$1.1bn of annualised revenue, but Core Scientific is billing 437MW, Cipher’s Black Pearl rent began in August and IREN targets US$4bn of operating ARR by December. We expect the revenue run-rate to more than double by the next report.
Financing terms will become a larger differentiator. Hut 8 raised US$7.5bn of non-recourse project debt in Q2, while Cipher and IREN secured funding at 6%. Project-level financing costs should become more useful than GAAP earnings, particularly after US$1.95bn of warrant remeasurement losses across three companies in Q2.
Appendix: methodology
Denominator: Self-mined BTC produced in the quarter.
Allocation: Self Mining Revenue / Total Revenue. Applied to SG&A, D&A, SBC, Interest, and Tax.
All-In Cost per BTC = Electricity (net of curtailment) + SG&A (excl. SBC) + D&A + Net Interest + Income Tax + SBC — all allocated by mining revenue share where applicable.
Cash Cost per BTC = Cost of Revenues (excl. D&A) + SG&A (excl. SBC) + Net Interest + Income Tax — all allocated.
Electricity is net of curtailment/demand-response credits. Excludes impairments, fair-value remeasurements, and non-operational items (e.g., BTC revaluation gains/losses, derivative fair value changes, debt conversion inducement expenses).
Values are in US$ thousands unless otherwise stated.