Framework für die 5-Jahres-Bewertung von Ethereum
 30 Min. Lesezeit
- Ethereum
- Altcoins
*Das vollständige Modell finden Sie im Anhang
Wir bewerten ETH anhand eines „Sum-of-Parts“-Frameworks, bei dem wir die Cashflow-Bewertung (F1) und die monetäre Aufschlagsbewertung (F2) mit einem Netzwerk-/Spekulations-Overlay kombinieren, was wiederum auf Bären- (Bear), Basis- (Base) sowie Bullenszenarien (Bull) projiziert wird. Die auffälligsten Outputs sind folgende:
Bear: ~1.443 USD impliziter Kurs bis 2031, was einer annualisierten Rendite von -9 % gegenüber dem aktuellen Kassakurs entspricht.
Base: ~4.935 USD impliziter Kurs bis 2031, was einer annualisierten Rendite von +16 % entspricht.
Bull: ~14.135 USD impliziter Kurs bis 2031, was einer annualisierten Rendite von +43 % entspricht.
1. Einleitung
Wir haben bereits zuvor ein umfassendes Framework erarbeitet, das unserer Meinung nach die logischste Methode zur Bewertung von Ether darstellte. Ethereum unterliegt recht häufigen Veränderungen; Netzwerk-Upgrades, Änderungen der Geldpolitik – all diese Faktoren zwingen uns dazu, unsere Sichtweise auf das Netzwerk und den zugrunde liegenden Token sowie deren Bewertung immer wieder anzupassen. Es liegt auf der Hand, dass der Markt derzeit Schwierigkeiten hat, den Preis für Ether zu bestimmen. Nachdem Dencun die Ausführung von der Basis-Layer weg verlagert hatte, brachen die Cashflows, die das vorherige Bullenszenario gestützt hatten, ein, obwohl die On-Chain-Aktivität Rekordhöhen erreichte. Die wöchentlichen Gebühren, die Anfang 2024 einen Höchststand von über 200 Mio. USD erreicht hatten, liegen nun bei knapp 10 Mio. USD, während sich die Zahl der monatlich aktiven Nutzer im gleichen Zeitraum etwa verdoppelt hat.
Im Kryptosektor werden widersprüchliche Ansichten geäußert. Einige sagen, dass mit dem Wegfall der Gebührendynamik auch der implizite Wert des Ether-Tokens verloren gegangen sei, während andere argumentieren, dass sich der Token zu einer Art Geld entwickelt habe, was einen Aufschlag rechtfertige, der mit dem von ihm gesicherten Ökosystem wachsen sollte. Beide Ansichten sind zum Teil korrekt und keine von beiden allein liefert eine stichhaltige Zahl.
Dieser Bericht stellt ein „Sum-of-Parts“-Framework vor, das versucht, Ether als eine Mischung aus beidem zu bewerten. Beim ersten Framework wird das Netzwerk als Unternehmen betrachtet, es werden Gebühreneinnahmen für die wichtigsten Nutzungskategorien prognostiziert und ein Multiplikator angewandt. Beim zweiten Framework wird Ether als Geld- und Sicherheitenbasis des größten Smart-Contract-Ökosystems betrachtet und die jährliche Nachfrage aus Staking, DeFi, Layer-2-Reserven, ETFs, Unternehmens-Treasuries und Käufen als Wertanlage beziffert. Bei der zweiten Komponente kommt ein Netzwerk- und Spekulationsaufschlag hinzu, der den Wert erfasst, der Ether durch die Sicherung einer wachsenden On-Chain-Wirtschaft zufließt, sowie die zyklische Marktstimmung, die die Preise während eines Bull Market weit über den Fair Value und während eines Bear Market weit unter den Fair Value treibt.
Ether ist weder eine Tech-Aktie noch digitales Gold. Es ist der native Vermögenswert einer genehmigungsfreien Plattform, auf der Builder im Grunde alles bereitstellen können und dabei von einer dezentralen Sicherheit, führender Liquidity und globalem Zugang profitieren. Innerhalb dieses Ökosystems fungiert Ether zudem als Zahlungsmittel und Sicherheit.
Der Output ist eine 5-Jahres-Prognose des Ether-Preises unter Bären-, Basis- und Bullenszenarien, ergänzt durch die vollständigen Modellannahmen. Vorab noch wichtig zu erwähnen: Anstatt den Fair Value von Ether von Null aus abzuleiten, verankern wir Framework 2 an der heutigen Marktkapitalisierung und projizieren den weiteren Verlauf von dort aus. Die Alternative, nämlich die Bewertung des monetären Aufschlags ausgehend von Null, erfordert Annahmen darüber, wie viel des globalen Goldbestands, der Geldmenge M2 oder des Gesamtmarktes (TAM) für Smart Contracts Ether erfassen „sollte“. Wir sind nicht der Auffassung, dass sich eine dieser Zahlen heute mit wirklicher Überzeugung begründen lässt.
Der Markt bewertet Ether derzeit mit etwa 260–284 Mrd. USD. Wir behaupten nicht, dass das korrekt ist. Wir behaupten jedoch, dass dieser Wert widerspiegelt, worauf sich Käufer und Verkäufer unter Berücksichtigung aller sichtbaren Informationen geeinigt haben: Gebühren nach Dencun, aktuelle Staking-Quoten, ETF-Flüsse, Wettbewerbspositionierung und Spekulation. Das Modell zerlegt diesen Wert in eine Cashflow-Komponente (Framework 1) und eine monetäre Restkomponente (Framework 2) und erstellt darauf aufbauend eine Prognose. Der Bericht gibt Aufschluss darüber, wohin sich der Ether-Preis über einen Zeitraum von fünf Jahren entwickeln könnte – nicht darüber, ob er heute falsch bewertet ist. Die Konsequenzen dieser Entscheidung werden im Abschnitt „Grenzen“ erörtert.
2. Ethereum hat sich stark verändert
Die Geldpolitik von Ethereum hat sich stärker verändert als die jedes anderen bedeutenden digitalen Vermögenswerts. Zwischen 2015 und 2022 basierte das Netzwerk auf dem Proof-of-Work-Verfahren mit einer durchschnittlichen jährlichen Emissionsrate von ca. 4,5 %[1]. Durch „The Merge“ (Zusammenführung) im September 2022 wurde Ethereum auf das Proof-of-Stake-Verfahren umgestellt, wodurch die Emissionsrate um über 90 % gesenkt wurde.
EIP-1559, eine äußerst weitreichende Netzwerkänderung, wurde im August 2021 umgesetzt und hat den Gebührenmarkt so umgestaltet, dass die Basisgebühr jeder Transaktion dauerhaft verbrannt – also aus dem Umlauf genommen – wird, anstatt an die Validatoren ausgezahlt zu werden. Der wirtschaftliche Effekt ähnelt dem eines Aktienrückkaufs, wobei das Netzwerk seine Einnahmen nutzt, um im Namen aller Inhaber den Umlauf zu reduzieren. Validatoren behalten vorrangige Trinkgelder und jeglichen aus MEV gewonnenen Wert. Derzeit fließen 80–95 % der Gebühreneinnahmen in die Verbrennung; 5–20 % gehen an die Validatoren.
Diese Kombination aus geringer Emission und Verbrennung ist der Grund für Ethers populäres Image als „Ultrasound Money“. Nach The Merge waren die Gebühreneinnahmen so hoch, dass die Verbrennung häufig die Emission überstieg und sich der Umlaufbestand in absoluten Zahlen verringerte. Die Bewertung von Ether auf der Grundlage seiner Gebühreneinnahmen war daher einfach und logisch. Die Nutzung führte zu Einnahmen, was wiederum zu einer Wertsteigerung für die Token-Inhaber führte.
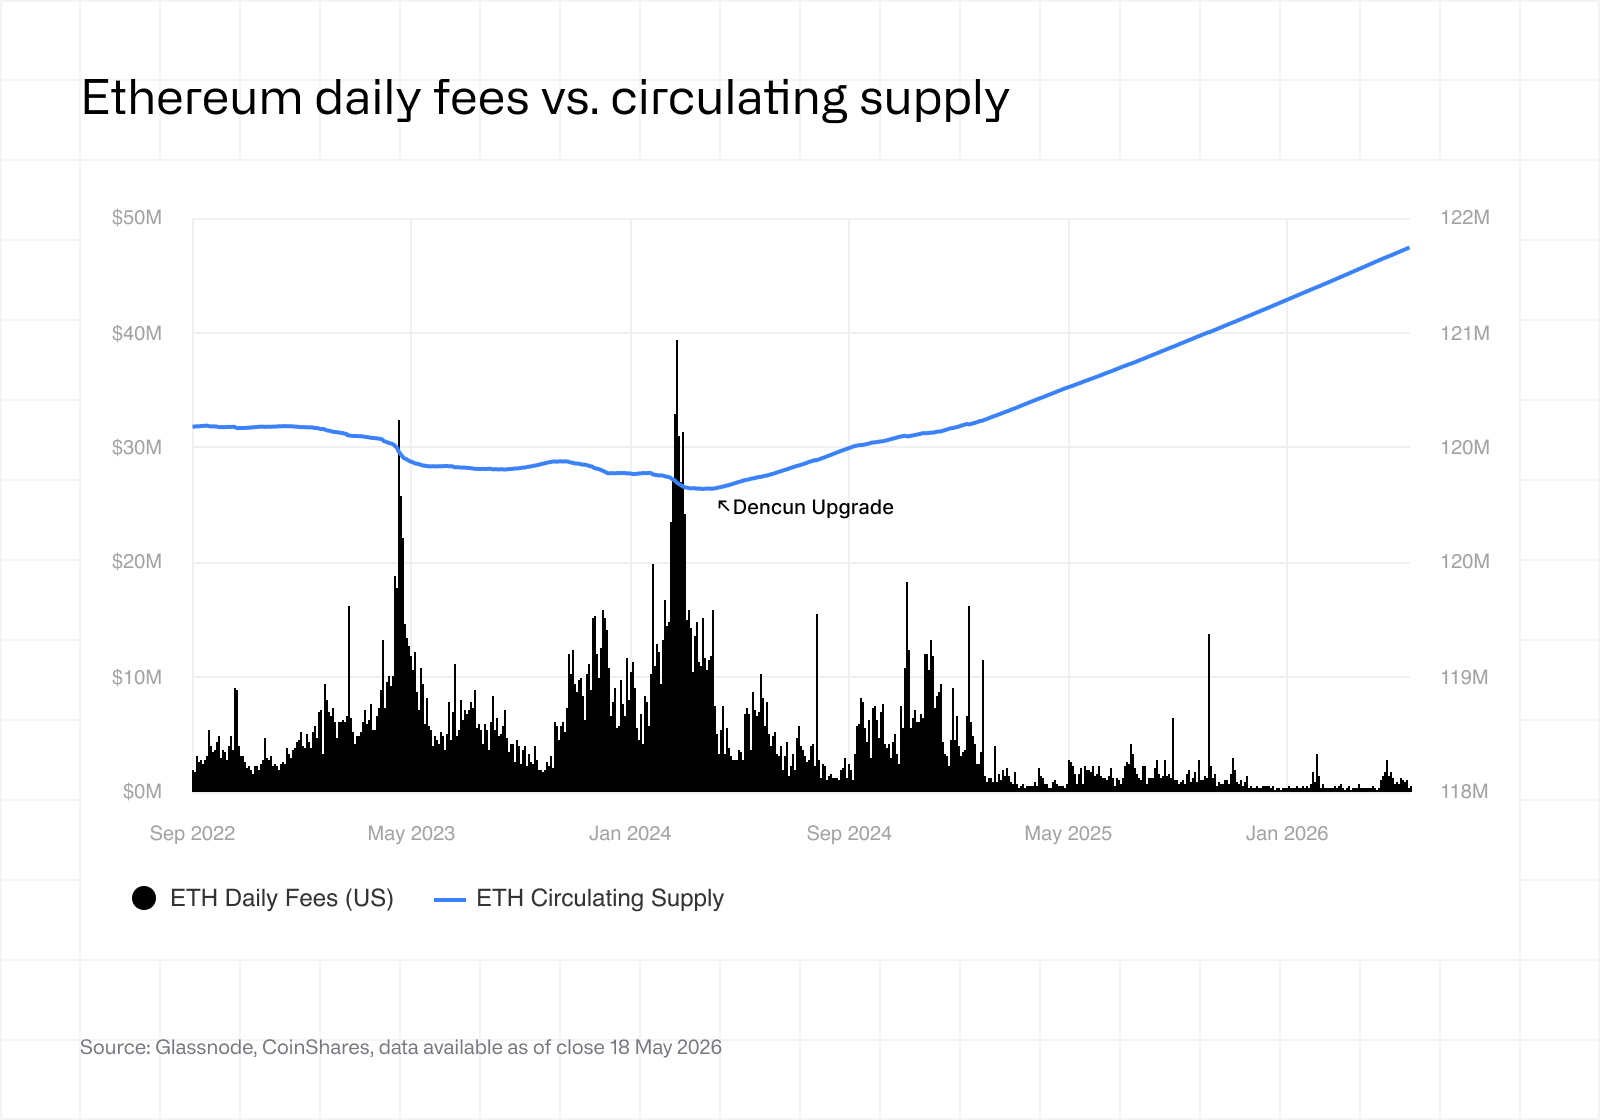 Das Dencun-Upgrade im März 2024 hat diese Übereinstimmung jedoch zunichtegemacht. Dencun führte Blob-Transaktionen ein, einen speziellen Kanal für die Datenverfügbarkeit, der es Layer-2-Netzwerken ermöglichte, komprimierte Transaktionsdaten zu einem Bruchteil der bisherigen Kosten an Ethereum zu übermitteln. Die Ausführung wurde damit weitgehend von der Basis-Layer weg verlagert. Der Durchsatz der Layer-2-Netzwerke stieg sprunghaft an, die für die Nutzer sichtbaren Transaktionskosten brachen ein, und die Gebühreneinnahmen, die zuvor den Cashflow von Ether gestützt hatten, sanken um eine Größenordnung. Unsere Analyse des Dencun-Upgrades befasst sich ausführlicher mit den technischen Details. Zusammenfassend lässt sich sagen, dass Ethereum eine Skalierung durch die Auslagerung der Ausführung an L2-Lösungen gewählt hat, was unmittelbar zu einem starken Rückgang der Gebühreneinnahmen auf L1 führte. Wie aus der obigen Grafik ersichtlich ist, sind die Gebühreneinnahmen drastisch gesunken, und Ether hatte Mühe, sein Image als „Ultrasound Money“ aufrechtzuerhalten.
Würde man eine rein cashflow-basierte Bewertung für Ether vornehmen, käme man zu dem Schluss, dass der Token drastisch überbewertet ist. Würde man hingegen eine grobe TAM-Analyse für digitales Gold durchführen oder Schätzungen darüber anstellen, wie viel Wert das Ethereum-Netzwerk in 3, 5 oder 10 Jahren sichern wird, käme man wahrscheinlich zu dem Schluss, dass der Token dramatisch unterbewertet ist. Der Grund, warum angesichts der am Netzwerk vorgenommenen Änderungen ein hybrider Ansatz erforderlich ist, liegt darin, dass die Nutzung noch nie so hoch war wie heute:
Die Menge an ETH, die auf L2s übertragen wird, liegt nahe des Allzeithochs.
Die Anzahl der aktiven Nutzer auf L2s liegt auf einem Allzeithoch.
Die Anzahl der aktiven Nutzer auf der Mainchain liegt auf einem Allzeithoch.
Zu behaupten, Ethereum sei gescheitert, wäre nicht korrekt. Das ist nicht der Fall – Ethereum bietet eindeutig genügend Nutzen, sodass sich immer mehr Nutzer dafür entscheiden, Transaktionen sowohl auf der Mainchain als auch auf Layer-2-Chains durchzuführen.
Die Analyse umfasst daher drei Komponenten. Die erste betrachtet Ethereum als Unternehmen und untersucht, welchen Wert seine Gebühreneinnahmen haben, hochgerechnet auf fünf Jahre und aufgeteilt in acht Aktivitätskategorien. Die zweite betrachtet Ether als Währungs- und Sicherheiten-Vermögenswert und beziffert die jährliche Nachfrage aus sechs Quellen: Staking, DeFi, Layer-2-Reserven, ETFs, Unternehmens-Treasuries und Käufe als Wertanlage. Bei der dritten Komponente handelt es sich um ein Aufschlags-Overlay, das auf der zweiten aufbaut. Sie berücksichtigt einerseits Netzwerkeffekte und andererseits die zyklische Marktstimmung, die für Preisausschläge über oder unter den Fair Value sorgt. Zusammen ergeben diese drei Komponenten einen impliziten Preis für den Token über einen Zeitraum von fünf Jahren unter verschiedenen Szenarien.
3. Framework 1: Ether als Cashflow-Vermögenswert
Ethereum ist ein Netzwerk, das Blockspace verkauft. Nutzer zahlen Gebühren für Transaktionen, und gemäß EIP-1559 werden diese Gebühren auf zwei Arten aufgeteilt. Die Grundgebühr, die (je nach Marktaktivität) 80–95 % der gesamten Gebühreneinnahmen ausmacht, wird dauerhaft vernichtet. Der Rest, bestehend aus Prioritätstrinkgeld und dem aus der Transaktionsreihenfolge gewonnenen Wert (MEV), fließt an die Validatoren. Das Verbrennen ist wirtschaftlich gesehen mit einem Aktienrückkauf vergleichbar, da es im Namen aller Ether-Inhaber das Angebot verringert. Es ist der wichtigste Mechanismus, durch den die Netzwerknutzung dem Token zugutekommt.
Betrachtet man Ethereum als Unternehmen und seinen Blockspace als Produkt, stellt sich ganz einfach die Frage: Wie hoch ist der Barwert der Einnahmen, die dieser Blockspace generieren wird, und was bedeutet das für den Fair Value? Die Gebühren werden im gesamten Modell in USD angegeben, um einen Zirkelschluss mit dem Ether-Preis selbst zu vermeiden.
Das Modell prognostiziert die Gebühreneinnahmen in acht Kategorien über einen Zeitraum von fünf Jahren. Die vier Kategorien mit dem größten potenziellen Beitrag sind DEX-Handel, Stablecoin-Transfers, DeFi-Aktivitäten (ausgenommen DEX) und das Posten von Layer-2-Daten über Blob-Transaktionen. Die übrigen vier (Ether-Transfers, Abwicklung realer Vermögenswerte, Staking-Aktivitäten und eine Restkategorie „Sonstiges“) sind kleiner und für die Gesamtgebührenumsätze größtenteils zu vernachlässigen. (Anmerkung: Die Datenübertragung auf Layer-2 ist ebenfalls zu vernachlässigen, wird aber unserer Ansicht nach im Laufe der Zeit höchstwahrscheinlich durch Netzwerk-Upgrades in irgendeiner Form modifiziert werden.)
Die vollständigen Annahmen und Outputs auf Kategorie-Ebene sind unten aufgeführt.
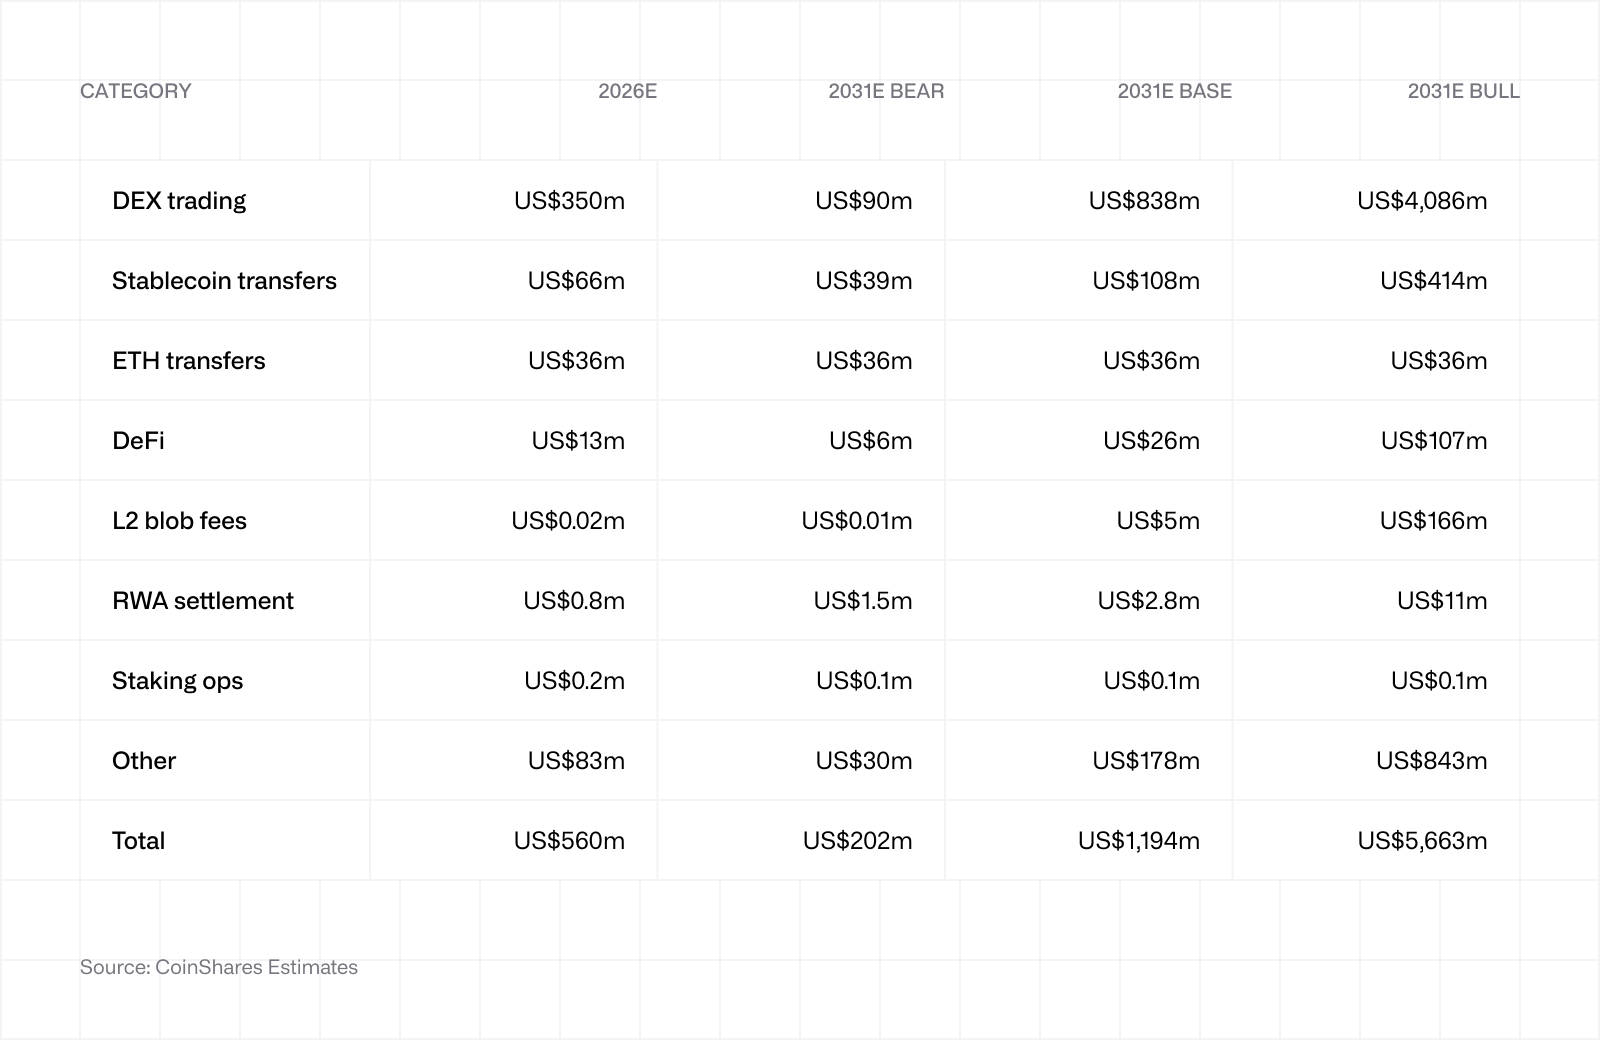 Der DEX-Handel ist im Basisszenario der größte Einzelbeitrag und die Kategorie, die am stärksten von Kursverlusten betroffen ist. Solana und andere alternative L1-Blockchains haben in den letzten 18 Monaten Marktanteile im DEX-Bereich gewonnen, während Base, Arbitrum und andere auf Ethereum abrechnen, ohne direkt zu den L1-Gebührenumsätzen beizutragen. Im Basisszenario bleibt der L1-Anteil unverändert bei 20 %, da davon ausgegangen wird, dass die Liquidity-Stabilität, die Präferenz institutioneller Anleger für die Abwicklung über Ethereum sowie die Vertiefung der On-Chain-Order-Books für tokenisierte Vermögenswerte einen weiteren Rückgang verhindern. Im Bärenszenario könnte der Anteil auf 11 % sinken, im Bullenszenario hingegen auf 35 % steigen, da sich die institutionellen Flüsse auf die Abwicklung über Ethereum konzentrieren.
Stablecoin-Transfers sind der zweitgrößte Beitrag. Auf Ethereum entfallen derzeit etwa 52 %1des gesamten Stablecoin-Angebots, wobei der Umlaufwert bei über 300 Mrd. USD liegt. Das Modell geht davon aus, dass dieser Anteil im Basisszenario konstant bleibt, während der zugrunde liegende Markt mit einer Wachstumsrate von 20 % wächst und bis 2031 ein Volumen von 870 Mrd. USD erreicht, wobei der Anteil von Ethereum einen On-Chain-Umsatz von ca. 450 Mrd. USD generiert. Der GENIUS Act wird als struktureller Rückenwind für das Jahr 2026 gewertet. Die Gebühren pro Übertragung sinken von 0,20 USD im Jahr 2026 auf 0,08 USD bis zum Jahr 2031, was die im Folgenden erläuterten Verbesserungen beim Durchsatz widerspiegelt.
Die Layer-2-Blob-Gebühren bleiben in allen Szenarien gering. Das ist beabsichtigt und kein Versehen. Die Einnahmen aus Blob-Gebühren hängen von einem sich verändernden Ziel ab, da das Netzwerk die Blob-Kapazität regelmäßig erhöht (derzeit 14 pro Block, bis 2031 voraussichtlich 24) und die Gebühren pro Blob eine Funktion der Nachfrage vor dem Hintergrund einer aggressiv steigenden Obergrenze bleiben. Das Modell geht davon aus, dass der Layer-2-Wert über dem später erläuterten Netzwerkaufschlag dem Ether zufließt, wobei zusätzliche wirtschaftliche Aktivitäten auf der Layer 2 eher über die Rolle des Ether als Abwicklungs- und Sicherheitenbasis als über direkte Gebühren zum Ether fließen. Die Blob-Mechanik könnte sich aufgrund von Netzwerk-Upgrades insgesamt anders entwickeln als angenommen.
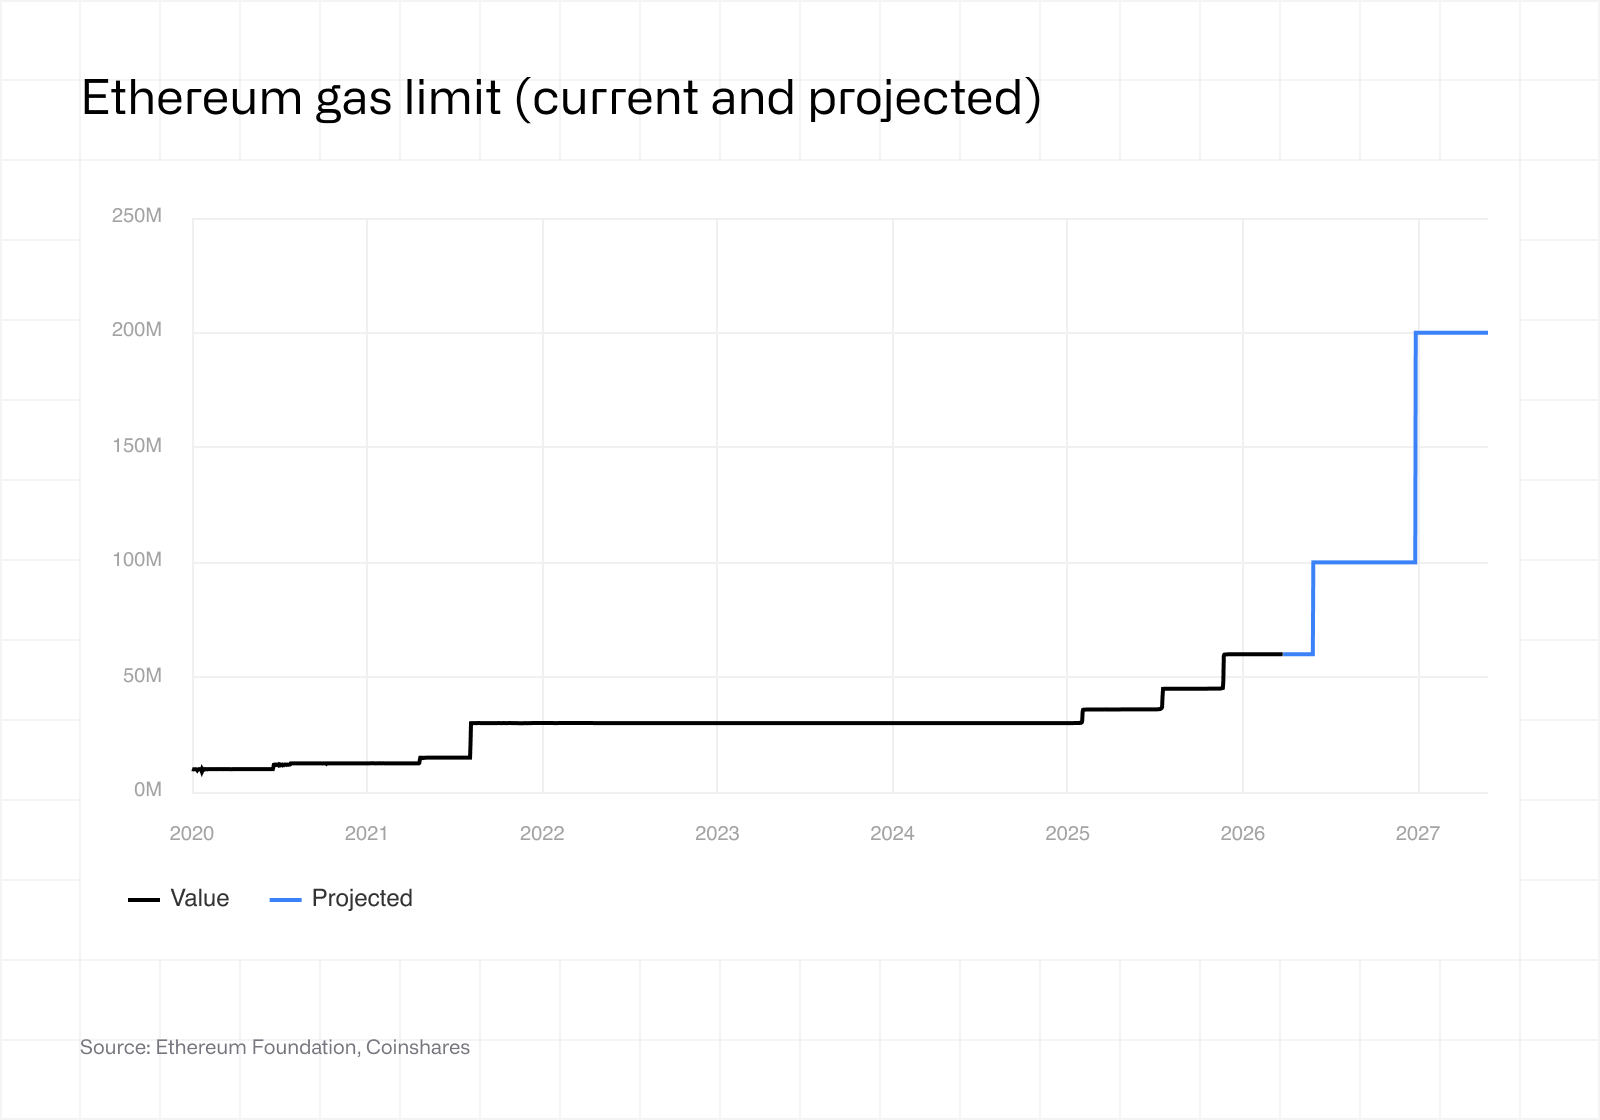
Bei unseren Prognosen haben wir aktuelle und zukünftige Netzwerkänderungen angemessen berücksichtigt. Das Gaslimit von Ethereum (vereinfacht ausgedrückt: die Anzahl der Transaktionen pro Block) hat sich im vergangenen Jahr von 30 Mio. auf 60 Mio. verdoppelt – die erste nennenswerte Erhöhung seit 2021. Das Glamsterdam-Upgrade, das derzeit für das dritte Quartal 2026 geplant ist, soll das Gaslimit auf 200 Mio. erhöhen – eine Steigerung um das 3,3-Fache –, verbunden mit paralleler Ausführung und einer fest verankerten Trennung von Proposer und Builder.
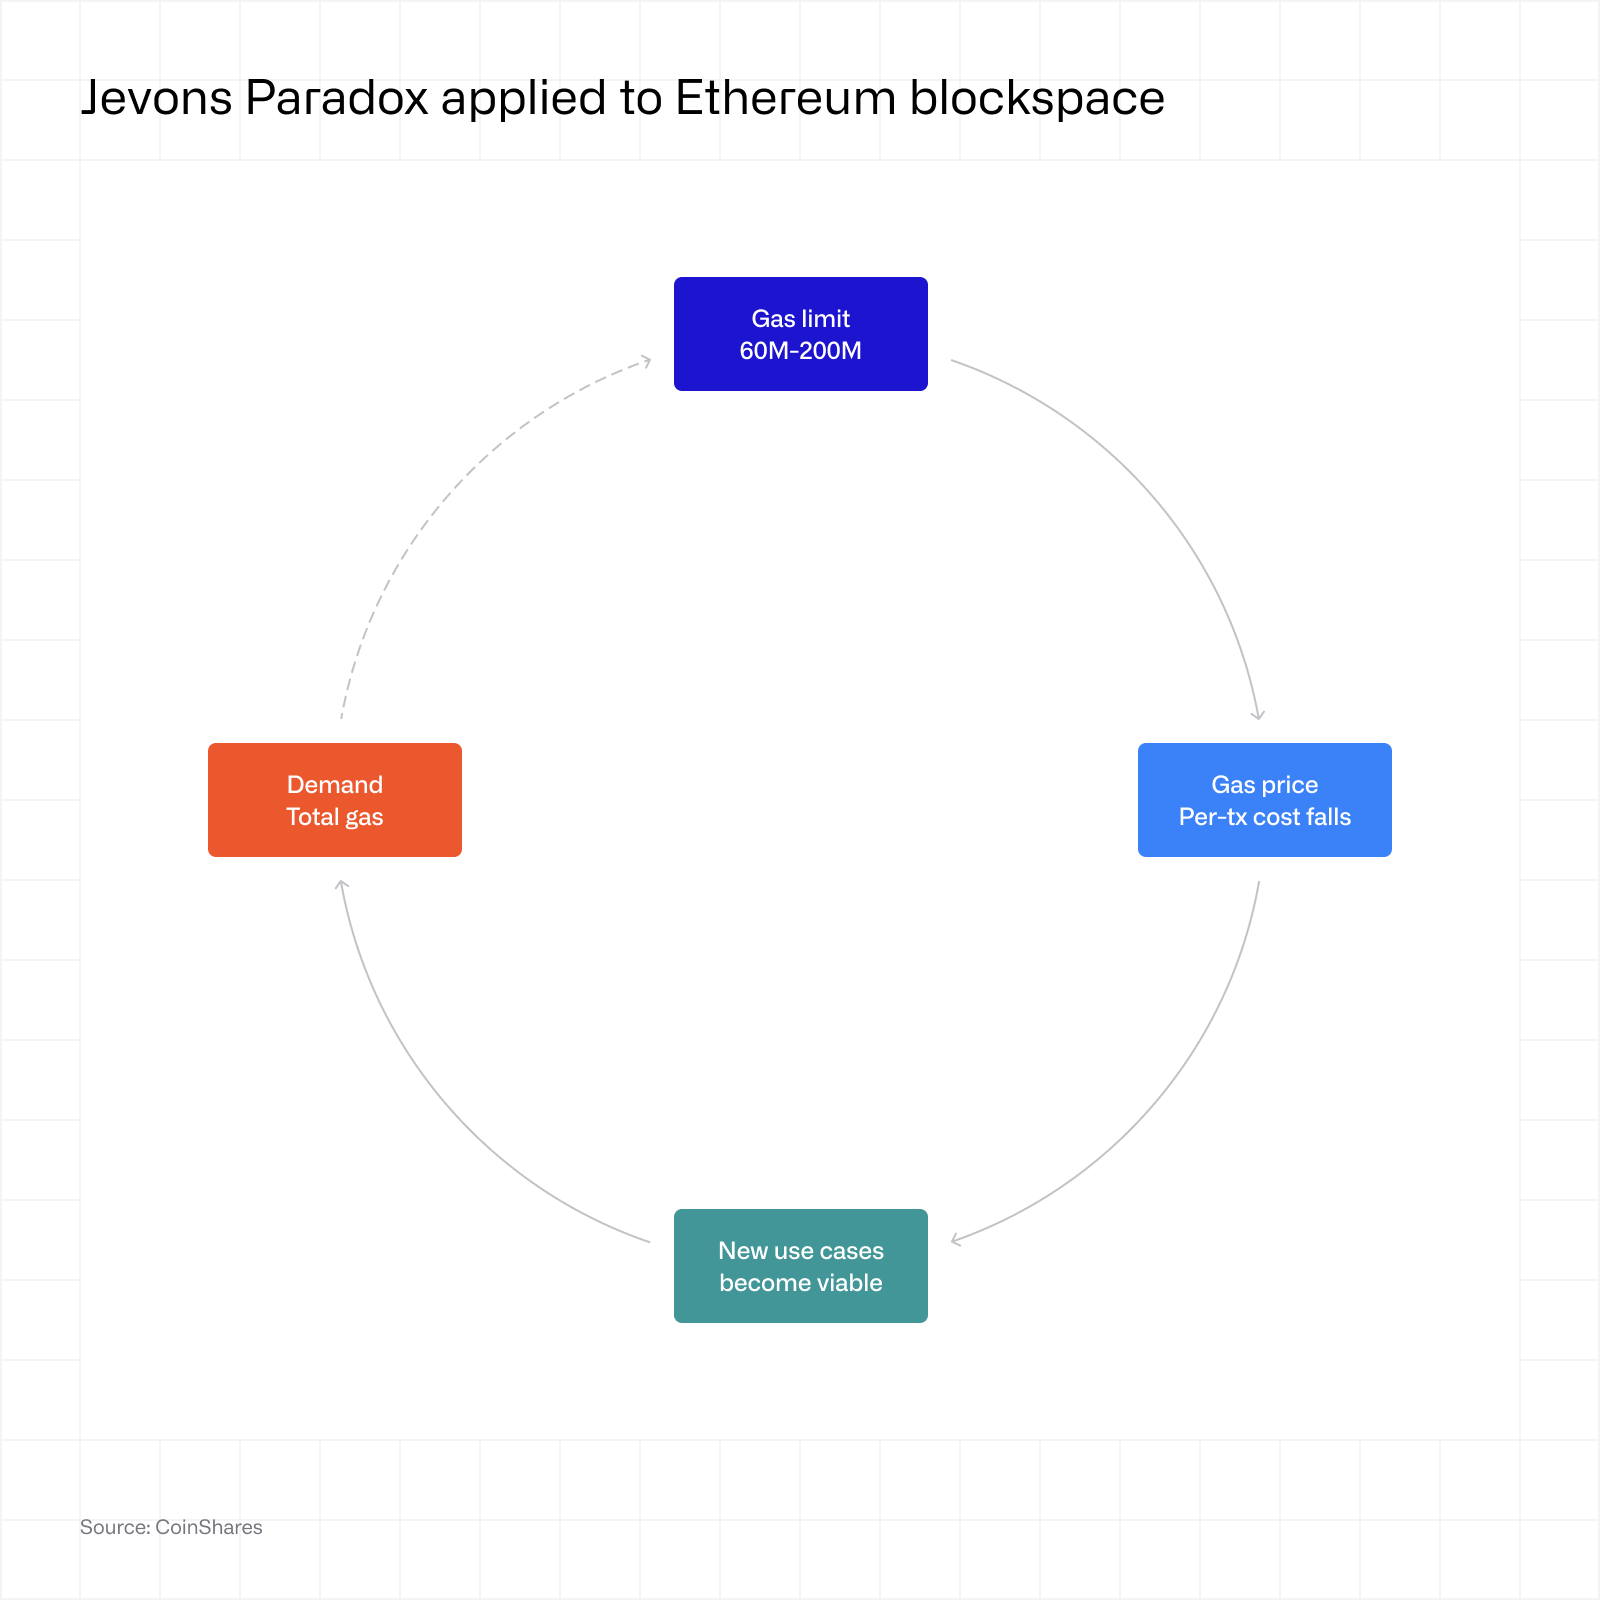
Hier kommt das Jevons-Paradoxon ins Spiel. Der Begriff beschreibt ein kontraintuitives Phänomen: Wenn die Kosten für die Nutzung einer Ressource sinken, steigt der Gesamtverbrauch oft so stark an, dass die Gesamtnutzung zunimmt, anstatt abzunehmen. Der Begriff fällt häufig unter Ethereum-Forschern und spiegelt das langfristige Ziel für das Netzwerk wider: Einzelne Transaktionen drastisch verbilligen, den Durchsatz um eine Größenordnung steigern und durch die Welle neuer Aktivitäten die Gesamteinnahmen aus Gebühren steigen lassen, auch wenn die Gebühren pro Nutzer sinken. Das Bullenszenario für die Cashflows von Ether hängt davon ab, ob sich diese Entwicklung tatsächlich vollzieht. Sollte die Nachfrage nicht schnell genug steigen, um die günstigeren Transaktionsgebühren auszugleichen, wird das Netzwerk letztendlich stärker ausgelastet und gleichzeitig weniger profitabel sein.
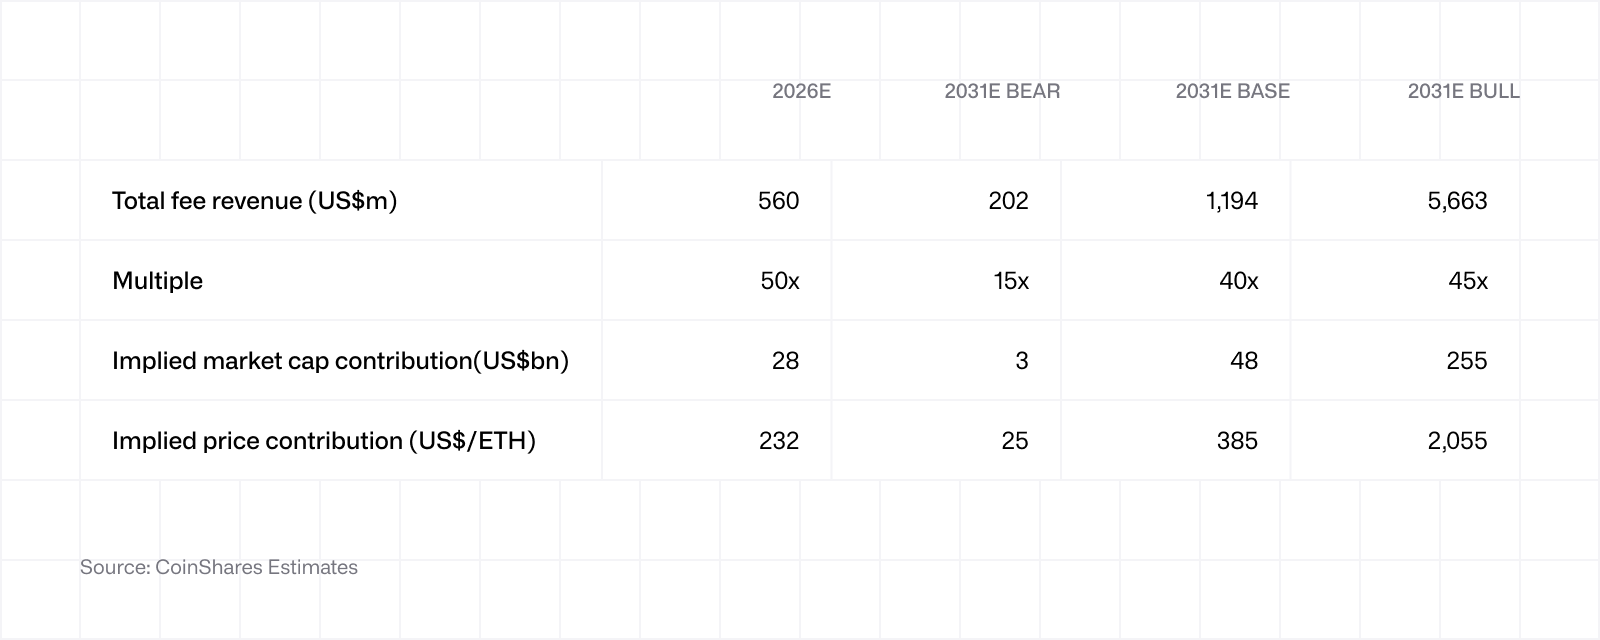
Auf die prognostizierten Gebühreneinnahmen wird ein Multiplikator angewendet, um den impliziten Beitrag zur Marktkapitalisierung abzuleiten. Im Basisszenario wird ein Multiplikator von 50x auf die Gebühren für 2026 angewendet, der bis 2031 auf 40x sinkt; im Bärenszenario geht er von 20x auf 15x zurück, im Bullenszenario liegt er bei 70x und sinkt im Laufe der Zeit auf 45x. Der Bereich von 40–50x ist für reife Märkte recht hoch, steht jedoch im Einklang mit profitablen Technologieunternehmen in der Frühphase, deren Gebühren mit einer durchschnittlichen jährlichen Wachstumsrate (CAGR) von 15–20 % steigen. Das Modell im Anhang zeigt, dass das Basisszenario einer erforderlichen Rendite von 12 % über fünf Jahre entspricht oder – nach Abzinsung – dem 48-Fachen der Gebühren für das Jahr 2026.
Framework 1 ergibt einen impliziten Ether-Preisbeitrag, der zwischen 25 USD im Bärenszenario für 2031 und 2.055 USD im Bullenszenario für 2031 sowie im Basisszenario bei 385 USD liegt. Das sind die Cashflow-Beiträge zum Gesamtbetrag.
4. Framework 2: Ether als Währungs- und Sicherheiten-Vermögenswert
Eine reine Cashflow-Bewertung erfasst zwar, was Nutzer für Transaktionen bezahlen, berücksichtigt jedoch nicht, wozu sie den Vermögenswert halten oder warum. Ether ist der native Vermögenswert eines Wirtschaftssystems, das tokenisierte Werte in Höhe von Hunderten von Milliarden Dollar absichert. Er wird für jede Transaktion im Netzwerk benötigt. Er ist die wichtigste Sicherheit auf den DeFi-Kreditmärkten. Er ist der Reserve-Vermögenswert, der von fast jedem Layer-2-Sequenzer und jeder Bridge gehalten wird. Er bildet die Grundlage für die aktivste Stablecoin-Wirtschaft, wobei in Ether abgewickelte Stablecoins mehr als die Hälfte des weltweiten Gesamtangebots an Stablecoins ausmachen. Keiner dieser Werte entsteht durch Gebühreneinnahmen und keiner davon wird von Framework 1 erfasst.
Das ist der monetäre Aufschlag. Der Wert, den Ether über seine Cashflows hinaus erzielt und der sich aus seiner Rolle als Sicherheit und Abwicklungswährung des größten Smart-Contract-Ökosystems ableitet. Framework 2 schätzt diesen Aufschlag und prognostiziert seine Entwicklung über einen Zeitraum von fünf Jahren.
Das Modell identifiziert sechs strukturelle Nachfragequellen. Die ersten drei spiegeln Ether wider, der auf bestimmte Funktionen beschränkt ist: Staking (derzeit rund 39 Mio.] Ether, die bei Validatoren hinterlegt sind), DeFi-Sicherheiten (Ether, der als Deckung für Kredit- und Liquidity-Positionen eingesetzt wird) und Layer-2-Reserven (Ether, der von L2-Sequenzern, Brücken und Treasury-Einheiten gehalten wird). Die verbleibenden drei sind flussbasiert und direkt in Dollar denominiert: ETF-Nettoflüsse, Käufe durch Unternehmens-Treasuries sowie Käufe als Wertanlage durch passive Inhaber.
Für die gesperrten Quellen wird die Veränderung der gehaltenen Ether-Menge im Jahresvergleich mit dem Spotpreis multipliziert, um den Kaufdruck in USD zu ermitteln, wobei der Spotpreis auf 2.350 USD festgelegt wird. Die sechs Quellen werden zum jährlichen Netto-Kaufdruck summiert.
Der Netto-Kaufdruck wird anschließend über einen Regime-Multiplikator in eine Auswirkung auf die Marktkapitalisierung umgerechnet, der die Preiselastizität des Netto-Kaufdrucks gegenüber dem Order Book erfasst. Der Multiplikator beträgt 0,7x im Bärenszenario, in dem Käufe angesichts zahlreicher verkaufsbereiter Anbieter leicht absorbiert werden. Im Basisszenario beträgt er 1,5x, was einen standardmäßigen Anstieg der Marktkapitalisierung um 1,5 USD pro investiertem USD widerspiegelt. Im Bullenszenario beträgt er 3x, da es hier tendenziell weniger verkaufsbereite Anbieter gibt, die Preisbildung positiver verläuft und der Kaufdruck verstärkt wird.
Diese Multiplikatoren sind im Vergleich zur wissenschaftlichen Literatur bewusst konservativ angesetzt. Das Krypto-Multiplikator-Modell von Garratt und van Oordt (BIS, 2023)2 legt die Untergrenze für die Reaktion der Marktkapitalisierung pro 1 USD Nettozufluss auf
M/(M-Z),
wobei Z den Bestand darstellt, der als Wertspeicher und nicht als Transaktionsumlauf gehalten wird. Da etwa 60 % der ETH entweder in Smart Contracts oder in inaktiven Adressen (> 6 Monate) liegen, beträgt die implizierte Untergrenze für Ether etwa das 2,5-Fache. Unser Bullenszenario mit 3x liegt knapp über diesem Wert. Unser Basisszenario mit 1,5x und unser Bärenszenario mit 0,7x liegen deutlich darunter. Wir halten die für jedes Szenario gewählten Multiplikatoren daher für vertretbar und eher konservativ.
Die jährlichen Marktkapitalisierungszuwächse werden über den gesamten Prognosezeitraum summiert und dann zu einer Basislinie addiert, die sich aus der aktuell beobachteten Marktkapitalisierung (~284 Mrd. USD) abzüglich der Marktkapitalisierung des Basisszenarios 2026 gemäß Framework 1 (28 Mrd. USD) ergibt, was 256 Mrd. USD ergibt. Das bedeutet letztlich, dass unsere Bewertung berücksichtigt, dass der aktuelle Kurs auf dem Bildschirm sich aus einer Vielzahl von Faktoren zusammensetzt, und unser Framework versucht, den weiteren Verlauf von diesem Punkt aus zu prognostizieren.
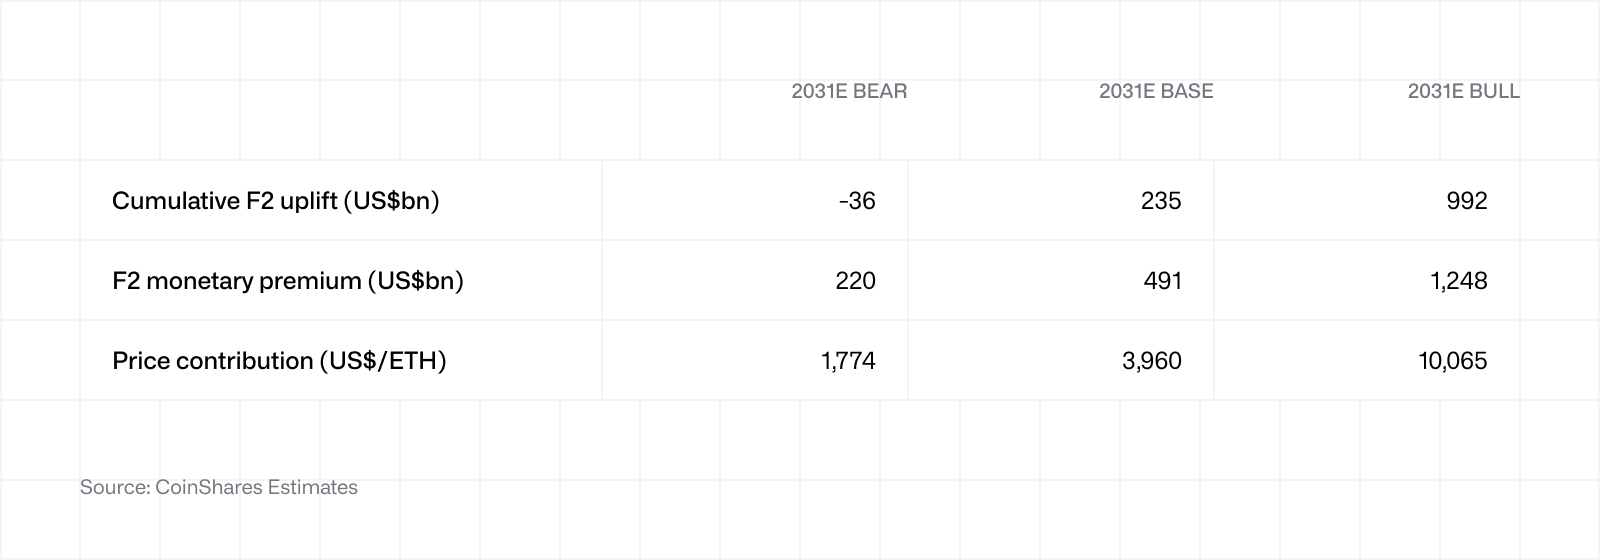
Framework 2 ergibt einen impliziten Ether-Preisbeitrag für 2031, der zwischen 1.774 USD im Bärenszenario und 10.065 USD im Bullenszenario sowie im Basisszenario bei 3.960 USD liegt. Dies ist eine breitere Streuung als bei Framework 1, was die Tatsache widerspiegelt, dass es letztlich eine sehr breite Streuung potenzieller Zustände gibt, in denen sich das Netzwerk in fünf Jahren befinden könnte.
5. Zusammenfassung der drei Komponenten
Die drei Komponenten summieren sich additiv zu einer Gesamtmarktkapitalisierung, die anschließend durch das prognostizierte Angebot geteilt wird, um einen impliziten Preis für den Ether-Token zu ermitteln. Die Formel lautet:
Gesamt = (F1-Marktkapitalisierung + F2 × (1 + Aufschlag)) ÷ prognostiziertes Angebot (122–124 Mio.)
Der Cashflow-Wert der Gebühreneinnahmen in Framework 1 ist bereits durch den in Abschnitt 3 angewandten Multiplikator erfasst, sodass die zusätzliche Anwendung eines Aufschlags eine Doppelzählung darstellen würde. Das Aufschlags-Overlay gilt nur für Framework 2. Für denselben Dollar an wiederkehrenden Käufen wird je nach der Position von Ethereum auf dem Markt für Smart-Contract-Plattformen ein Auf- oder Abschlag gewährt.
Das Aufschlags-Overlay besteht aus zwei Komponenten:
Netzwerkwert: Der strukturelle Aufschlag, den Ether als Sicherheits- und Abwicklungsschicht einer wachsenden On-Chain-Wirtschaft genießt.
Spekulation: die zyklische Marktstimmung, die die Preise während eines Bull Market weit über den Fair Value und während eines Bear Market weit unter den Fair Value treibt.
Aufschlag in Prozent nach Szenario:
Basisszenario: 12 % im Jahr 2026, ab 2027 steigend auf 15 %.
Bullenszenario: Durchgehend 20 %, was den historisch hohen Aufschlag widerspiegelt, den Ethereum während Bull Markets erzielt hat.
Bärenszenario: negativ, von -5 % im Jahr 2026 auf -20 % bis 2031. (Ethereum/Krypto ist gescheitert)
Zusammensetzung des Overlays im Zeitverlauf. Das Verhältnis zwischen Netzwerkwert und Spekulation verschiebt sich mit zunehmender Reife des Netzwerks. Im Jahr 2026 ist das Overlay stärker auf Spekulation ausgerichtet, was die aktuelle Marktpositionierung widerspiegelt, in der die Stimmung die Grundlagendaten dominiert. Bis 2031 wächst der Anteil des Netzwerkwerts am Aufschlag, da davon ausgegangen wird, dass die wahrgenommene Risikobelastung sinkt und sich die Netzwerkeffekte bei größerer Ökosystemgröße verstärken.
Basisszenario: Der Netzwerkwert steigt von 25 % des Overlays im Jahr 2026 auf 60 % bis 2031.
Bullenszenario: Der Netzwerkwert erreicht bis 2031 80 % des Overlays.
Die Kombination der drei Komponenten ergibt das Output des Frameworks. Die impliziten Marktkapitalisierungen und impliziten Preise für 2031 sind unten dargestellt.
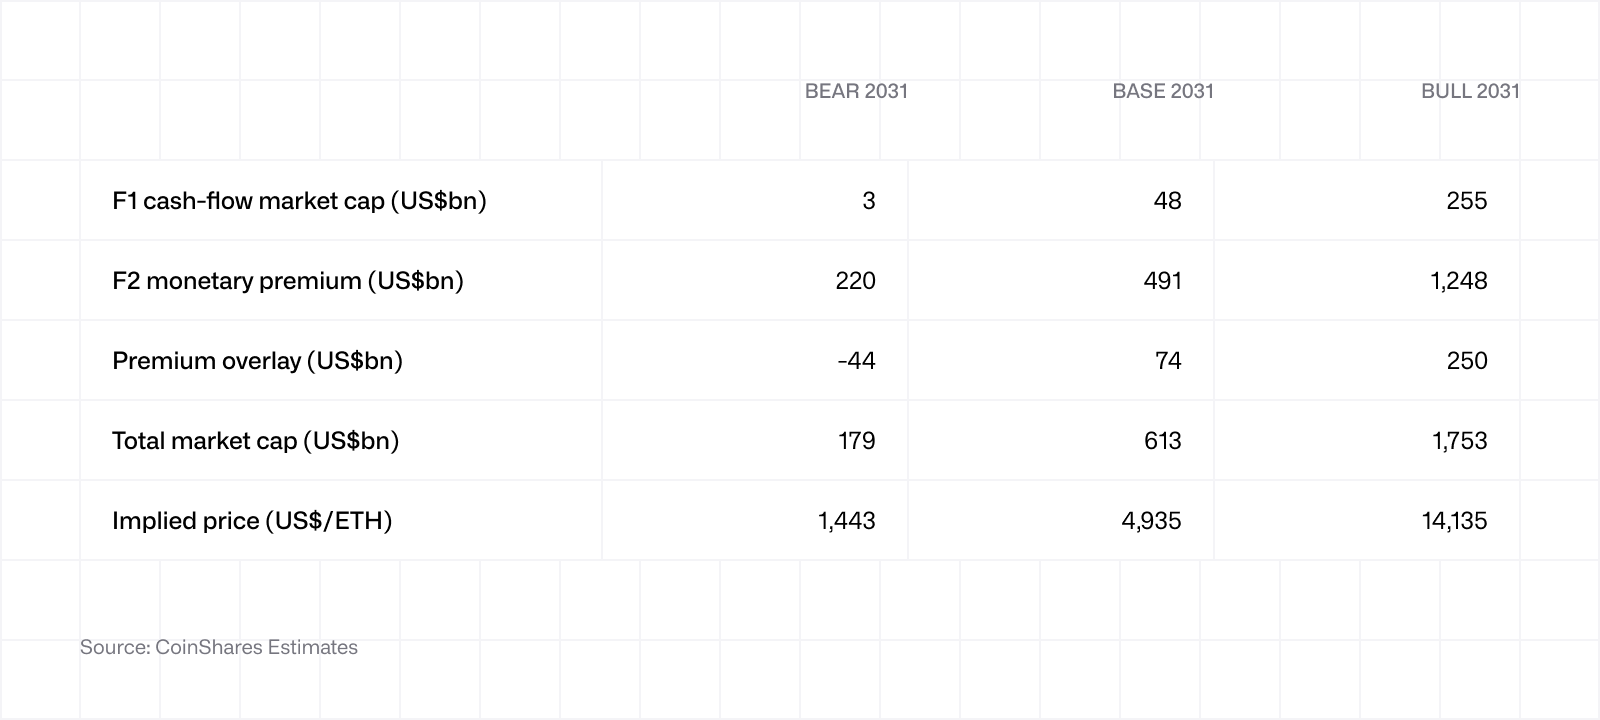
Die drei Komponenten tragen nicht gleichermaßen zum Gesamtergebnis bei. In allen Szenarien ist Framework 2 der größte Einzelfaktor für das Gesamtergebnis, was die Sichtweise des Modells widerspiegelt, dass der monetäre Aufschlag die dominierende Quelle für den Wert von Ether ist.
6. Szenarien und Outputs
Bärenszenario (1.443 USD bis 2031)
In dem Bärenszenario verliert Ethereum seine Position – entweder an konkurrierende Layer-1-Blockchains oder weil sich die allgemeine These, dass Krypto eine produktive Anlageklasse darstellt, nicht bewahrheitet hat. Die Gebühreneinnahmen gehen gegenüber den aktuellen Run-Rates zurück, anstatt sich zu erholen, wobei der Marktanteil der DEX auf 11 % schrumpft, da alternative Handelsplätze Aufmerksamkeit und Handelsvolumen auf sich ziehen. Der Anteil der Stablecoins bleibt mit 40 % zwar weiterhin wettbewerbsfähig, das allgemeine Wachstum bei Stablecoins bleibt jedoch aus und der Markt stagniert gewissermaßen.
Die strukturellen Nachfragequellen werden durchweg negativ. Staking geht zurück, weil Validatoren aussteigen, DeFi-Sicherheiten schrumpfen, Layer-2-Reserven schwinden, ETFS verzeichnen anhaltende Nettoabflüsse gegen Null und Unternehmens-Treasuries werden zu Nettoverkäufern, weil Treasury-Unternehmen für digitale Vermögenswerte ihre Bilanzpositionen abbauen. Das Aufschlags-Overlay wird zum Abschlag.
Zu den mit diesem Szenario verbundenen Risiken zählen regulatorische Hemmnisse im Rahmen von Gesetzen wie dem CLARITY Act, die intermediär gestützte Strukturen gegenüber genehmigungsfreier DeFi begünstigen, anhaltender Wettbewerbsdruck durch Blockchains mit höherem Durchsatz sowie Langzeitrisiken, darunter Entwicklungen im Bereich des Quantencomputings, die Annahmen im gesamten Bereich der digitalen Vermögenswerte beeinflussen. Letztere Risiken gelten jedoch eher allgemein und nicht speziell für Ethereum.
Basisszenario (4.935 USD bis 2031, 16 % CAGR)
Das Basisszenario geht davon aus, dass sich die aktuellen Wachstumstreiber für Ethereum in moderatem Tempo fortsetzen und Ethereum die dominierende Smart-Contract-Blockchain bleibt. Das DEX-Volumen wächst mit einer CAGR von 17 %, wobei der Marktanteil unverändert bei 20 % bleibt. Das Stablecoin-Angebot auf Ethereum erreicht bis 2031 etwa 450 Mrd. USD, was mit den positiven Auswirkungen des GENIUS Act und den historischen Wachstumsraten im Einklang steht. Der TVL im DeFi-Bereich wächst mit einer jährlichen Wachstumsrate von 25 % (auch wenn argumentiert werden könnte, dass die jüngsten DeFi-Exploits diese Entwicklung gefährden), die Tokenization von RWA schreitet stetig voran und die Layer-2-Aktivitäten tragen durch einen Anstieg der über Brücken transferierten bzw. stationären ETH zum Wachstum bei.
Die ETF-Zuflüsse steigen bis 2031 auf jährlich 25 Mrd. USD, die Allokationen von Unternehmens-Treasuries nehmen allmählich zu und die Käufe als Wertanlage nehmen mit zunehmender Reife der Anlageklasse zu. Hier wenden wir einen Aufschlag von 12–15 % auf das Netzwerk an, da Ethereum seine prognostizierten Wachstumsraten erfüllt und vom Markt – mit einer gewissen spekulativen Begeisterung – belohnt wird. Das implizierte Aufwärtspotenzial gegenüber dem aktuellen Kassakurs beträgt ~110 % über fünf Jahre, was einer annualisierten Rendite von 16 % entspricht.
Bullenszenario (14.135 USD bis 2031, 43 % CAGR)
Das Bullenszenario setzt voraus, dass sich die sechs in Abschnitt 4 identifizierten Nachfragekatalysatoren auf hohem Niveau verstärken und Ethereum seinen Marktanteil im Laufe der Zeit ausbaut, anstatt ihn lediglich zu halten. Die Gebühreneinnahmen erreichen bis 2031 5,7 Mrd. USD, gestützt durch DEX-Volumina, die bis 2031 mit einer CAGR von 25 % steigen, wobei der Anteil von L1 auf 35 % zunimmt (bei einem deutlichen Rückgang der Gebühren pro Nutzer). Das Stablecoin-Angebot erreicht 2,8 Bio. USD bei einer CAGR von 50 % und entspricht damit dem Optimismus von Scott Bessent, der im Einklang mit der Annahme des GENIUS Act im Bullenszenario steht, während die RWA-Tokenization speziell auf Ethereum auf 420 Mrd. USD ansteigt. Man könnte das als ein Szenario betrachten, in dem alles perfekt gelaufen ist.
Die strukturellen Nachfragequellen bleiben auf hohem Niveau, wobei die ETF-Flüsse jährlich 40 Mrd. USD erreichen, die Käufe von Unternehmen auf 25 Mrd. USD ansteigen und die Nachfrage nach Wertanlagen deutlich zunimmt. Der Regime-Multiplikator von 3x spiegelt einen Mangel an verkaufswilligen Anlegern in einem mehrjährigen Bull Market wider, in dem ein Netzwerk die optimistischsten Prognosen übertrifft. Das Aufschlags-Overlay verliert mit der Zeit an spekulativem Charakter und ist zunehmend auf die etablierten Netzwerkeffekte zurückzuführen, da Ethereum zu dem Schauplatz für On-Chain-Finanzgeschäfte wird. Das implizierte Aufwärtspotenzial gegenüber dem aktuellen Kassakurs beträgt ~500 %, was einer annualisierten Rendite von 43 % entspricht.
7. Fazit
Wir gehen davon aus, dass das wahrscheinlichste Szenario irgendwo zwischen dem Basis- und dem Bullenszenario liegt. Ethereum muss nicht in jeder Kategorie gewinnen, um bis 2031 die Marke von 4.935 USD zu knacken. Es muss seinen DEX-Anteil in etwa auf dem aktuellen Niveau halten, seine Position bei den Stablecoins sichern, Skalierungs-Upgrades umsetzen (zuerst Glamsterdam, dann andere) und einen Anstieg der ETF-Flüsse verzeichnen, um auf marktkapitalisierungsbereinigter Basis mit Bitcoin gleichzuziehen. Nichts davon erfordert unrealistische Annahmen, und es könnte durchaus sein, dass sich diese als viel zu konservativ erweisen. Das Bullenszenario setzt voraus, dass mehr richtig läuft, als wir heute mit Sicherheit sagen können, und das Bärenszenario setzt voraus, dass unsere Annahmen auf ganzer Linie falsch liegen – sei es durch ein konkurrierendes Ökosystem, das Ethereum verdrängt, oder durch ein allgemeines Versagen der Krypto-Infrastruktur.
Ether ist weder eine Tech-Aktie noch digitales Gold, und jedes Rahmenkonzept, das es lediglich als das eine oder das andere behandelt, wird unserer Ansicht nach nicht das gesamte Wertversprechen erfassen. Die derzeitige Verwirrung am Markt darüber, wie Ether zu bewerten ist, spiegelt genau das wider. Nach Dencun sind die Gebühren gesunken, aber die Gesamtnutzung des Netzwerks hat weiter zugenommen, was in der Mainnet-Aktivität und den TPS der Layer-2-Lösungen zum Ausdruck kommt.
Das ist eine Möglichkeit, Ether zu bewerten – aber nicht die einzige. Andere Frameworks sind ebenso vertretbar und bieten unterschiedliche Blickwinkel auf das Netzwerk und den Token. Kein einfaches Unterfangen – und wenn es so wäre, gäbe es eine allgemein akzeptierte Methodik.
Diese beiden Frameworks zielen darauf ab, das zu erfassen, was wir als vielschichtigen Vermögenswert betrachten – einen Wert, der sich im Laufe der Zeit verändert (manchmal zum Guten, manchmal zum Schlechten) und sich zu einem noch unklaren, aber zunehmend deutlicher werdenden Endspiel entwickelt. Derzeit sieht dieses Endspiel in etwa so aus: Die Mainchain so aggressiv wie möglich skalieren, ohne dabei Kompromisse bei der Sicherheit oder Dezentralisierung einzugehen; die Transaktionskosten so weit senken, dass Finanztransaktionen in großem Umfang auf der Blockchain abgewickelt werden können; Ether als den Vermögenswert, der das gesamte System absichert und abwickelt, weiterhin im Mittelpunkt stehen lassen.
Grenzen
Framework 2 orientiert sich an der aktuellen Marktkapitalisierung und wird nicht von Null aus abgeleitet. Der Ausgangswert von 256 Mrd. USD ergibt sich aus der heute beobachteten Marktkapitalisierung abzüglich des Basiswerts für 2026 aus Framework 1. Das Modell stellt somit eine auf der aktuellen Positionierung basierende 5-Jahres-Prognose dar und ist keine Schätzung des heutigen Fair Value. Wer nach einer eindeutigen Antwort auf die Frage „Ist Ether heute unterbewertet?“ sucht, wird hier nur eine vorläufige Antwort finden.
Der Regime-Multiplikator spielt in Framework 2 eine große Rolle:
● Ein Basisszenario mit einem Multiplikator von 1,0x statt 1,5x senkt den impliziten Basispreis für 2031 um ca. 15 %.
● Ein Bullenszenario mit einem Multiplikator von 2x statt 3x senkt den impliziten Bullenpreis für 2031 um ca. 23 %.
Die Multiplikatoren sollen eine konservative Schätzung darüber liefern, wie stark die Preisverstärkung je nach Typ des aktuellen Marktregimes variiert.
Der Multiplikator von 40–50x in Framework 1 ist vertretbar, aber nicht risikofrei. Der Anhang zeigt, dass die Kalibrierung mit einer erforderlichen Rendite von 12 % über fünf Jahre vereinbar ist, was dem Niveau profitabler Technologieunternehmen in der Frühphase entspricht. Wenn der Markt stattdessen einen Multiplikator für ausgereifte Infrastruktur (10–15x) anwendet, verringert sich der Beitrag von Framework 1 stark.
Die Wirtschaftlichkeit von Layer-2-Lösungen bleibt eine strukturelle Unsicherheit. Das Modell geht davon aus, dass die Blob-Gebühren gering bleiben und dass der L2-Wert eher durch den Netzwerkaufschlag von Framework 2 als durch direkte Gebühren in Framework 1 entsteht. Angesichts der aktuellen Netzwerkparameter ist das ziemlich plausibel, die Preisgestaltung für Blobs könnte in Zukunft jedoch leicht geändert werden. Sollten sich die wirtschaftlichen Rahmenbedingungen nach Glamsterdam wesentlich verändern, müsste wahrscheinlich ein großer Teil dieser Methodik überarbeitet werden.
Was wir im Auge behalten werden
Entwicklung der Gebühreneinnahmen bis 2027. Die aktuelle Run-Rate liegt im historischen Vergleich auf einem niedrigen Niveau. Das Basisszenario setzt eine Erholung voraus, da die Aktivität nach Glamsterdam zunehmen wird.
ETF-Flüsse. Derzeit schwach und ein zentraler Faktor in unserer prognostizierten Nachfrage für das Basis- und das Bullenszenario in Framework 2.
Meilensteine beim Gaslimit. Glamsterdam könnte im 3. Quartal 2026 das Gaslimit auf 200 Mio. erhöhen. Weitere Veränderungen könnten schneller oder langsamer eintreten. Wir haben die Transaktionsgebühren für einzelne Kategorien und die Anzahl der Transaktionen auf der Grundlage von Annahmen modelliert. Diese Annahmen müssen möglicherweise angepasst werden.
Änderungen der Geldpolitik. Jede weitere Anpassung der Emission, Burn-Mechanismen oder Validatoren-Ökonomie würde den Angebotsverlauf verändern.
Blob-Mechanismen. Das Modell geht davon aus, dass die Blob-Gebühren gering bleiben. Eine Änderung der Blob-Preispolitik oder des Zeitplans für die Kapazitätserweiterung würde eine Überprüfung der L2-Annahmen von Framework 1 erfordern.
Hard Forks. Größere Protokolländerungen außerhalb der geplanten Upgrade-Roadmap (Sicherheitspatches, umstrittene EIPs, durch die Governance veranlasste Umstellungen) führen zu Unsicherheiten im gesamten Modell.
Quantenabsicherung. Sollten sich die Forschungsschwerpunkte in Richtung quantenresistenter Kryptografie verlagern, könnten sich die Skalierungsbemühungen verlangsamen. Dies ist in unserem 5-Jahres-Zeitraum ein Szenario mit geringer Wahrscheinlichkeit, auf längere Sicht jedoch ein reales Risiko.